Is our Marketing really working ?

Marketing Metrics 

The use of marketing metrics has increased tremendously, which makes it an important instrument to measure marketing performances. Marketing metrics permit companies to justify their investment in their marketing strategy, and to predict the financial impacts and difficulties (Vianello cited in Cohard et al. 2014). In order for a company to increase their value, they need to measure and evaluate their performance through marketing metrics.

pic

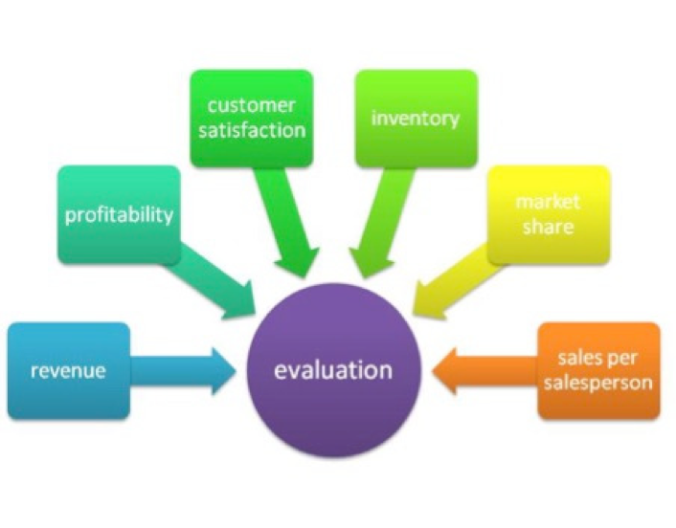
Figure 1:Performance measurement (Tescasia 2015)

The figure above illiterates what marketing metrics hopes to achieve:an increase in profits due to an evaluation and adaptation of ones marketing mix to meet customer needs. 


Many researchers have attempted to define what metrics categories and marketing metrics are used together, which are summarized in the image below:

replace.JPG

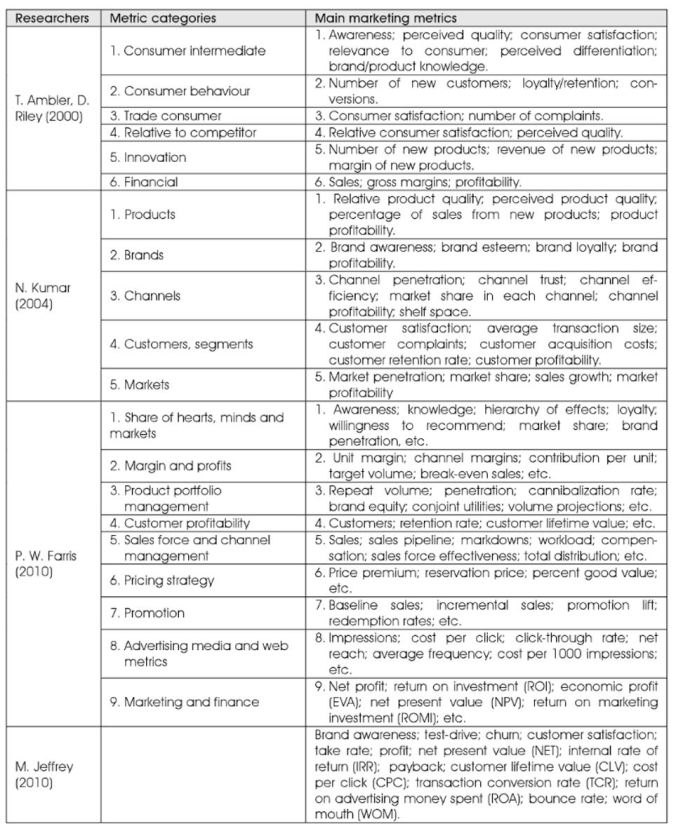
Table 1: Metrics categorized by competent researchers (Salkovka cited in Cohard et al. 2014)

Cohard et al. (2014) found that the most commonly used marketing metrics in companies are actually non-financial, such as market share, customer satisfaction, customer loyalty/retention, brand equity and innovation. All of these aspects are important; however, electronic commerce has impacted how marketers may measure metrics. An increased number of customers are spending more time shopping for books, music, appliances, airline tickets and groceries online, which has made the Internet a commodity for many. The U.S. Census Bureau announced that the 2016 second quarter retail e-commerce sales was $97.3 billion, which means that there is a great opportunity for companies to excel online. Therefore, marketers need to not only measure traditional metrics, but online metrics as well. The good news is that there is a whole career path dedicated to studying and interpreting online metrics; so, we actually have marketers who specialise in this field.

DeMers (2014) states that there multiple Online marketing metrics that are important for companies to measure. Some of these include:

Total Visits

he total amount of visits on a company’s main website should be the primary target for current customers and potential customers. The measurement of the total number of visits will allow the company to see how well their advertising campaign is going. If the number of visits declines from month to month this will give you a chance to do an investigation and potentially fix the problem. Generally, if the marketing campaign is steady the number of visitors are expected to grow steadily.(See illustration in  figure 2 below) .

good Eg of google analytics.jpg

Figure 2:Google Analytics example:(Busnessbee n.d)


New visits 

This is a metric found in Google Analytics that lets you know the total number of new visits on your company’s site as well as the number of repetitive visitors. This is great metric as it will show you if your site is attractive enough to encourage repeat customers and also shows how effective the campaign outreach efforts are. If for example you change the content or structure of your website and this ratio significantly drops then you know this particular campaign it not working and adjust it.(See figure 2 above)

Channel-Specific Traffic

A company’s channel-specific metrics can be found in the “Acquisition” section of Google Analytics. The companies traffic will be based on their point of origin by the company’s channel-specific metrics. This is very useful as just the total visits number cannot give an indication of which channel is used the most frequently. Within channel-specific traffic there are four main variables, including:

1.Direct – the number of people who visited the site directly.

2.Referrals– the number of external links from other websites.

3.Organic– site visitors who found the site by searching.

4.Social– the number of people who found the site though social media.

Bounce Rate

This is the total percentage of people who leave the site before further clicking on anything on the webpage. It is preferred for this to be low as you would want people to stay on your site for longer so that they can be more likely to take action on it.

Lead to Close Ratio

This measures sales success and shows the context of the company’s total return on investment. This metric is found by dividing the total number of the firm’s sales by the total number of its leads.

Customer Retention Ratio

This can be difficult to measure if your company sells one-time only products but things such as subscription based services enables businesses to easily measure retention. Customer retention can be calculated by simply calculating the percentage of return customers.

It is important for a company to regularly check the above mentioned metrics as well. Overtime the advertising campaign and sites can be adapted accordingly to the best working strategies to allow a stable marketing rhythm that will generate optimal profits.

last-pic

Figure 3:Illustration of online metrics

Reference List

Cohard JCR, Goze ,M, Testa,F, Marcone, MM,Patier CC, Peyrefitte M, 2014 , Arethuse, Scientific Journal of Economics and Business Management. 

Tescasiu, B 2015, Considerations upon ‘marketing metrics’, Bulletin of the Transilvania University of Braşov, vol. 8, Economic Science, Business Source Complete.

http://digitalmarketingphilippines.com/14-most-important-metrics-to-focus-in-your-digital-marketing-campaign/

http://www.forbes.com/sites/jaysondemers/2014/08/15/10-online-marketing-metrics-you-need-to-be-measuring/#34219f20355f

http://www.business2community.com/online-marketing/10-online-marketing-metrics-critical-to-your-campaigns-performance-01342852#zmz0hvTEmpfRp6VB.97

https://www.census.gov/retail/mrts/www/data/pdf/ec_current.pdf

Set Up Google Analytics for Your Website in 5 Easy Steps

Mavis Maravanyika

mavis1306-216041785


Marketing Metrics: What you need to know.

The importance and relevance of marketing has been analyzed ad naseum throughout this semester by students one and all. This very site has played host to a myriad of interesting viewpoints all emphasizing the importance of marketing in the modern strategic environment, however one key factor in the strategic marketing process has yet to be explored; the evaluation of marketing.

Whilst the numerous theories behind the various marketing elements have been explored extensively, the implementation of these tools is dramatically affected by the ability for an organization to measure the effectiveness of these tools. In order to do this, organisations must adopt an honest and open minded approach evaluating performance, in order to maximize the output of their marketing strategy, and, in turn yield maximum value for their marketing investment.

Much like the posts on this site, the quality of the work whilst submitted with the best of intentions can only be quantifiably evaluated by the mark given with respect to the relevant criteria, by the same token, the effectiveness of marketing activities can be measured with respect to marketing metrics. These metrics range in type to provide a comprehensive form of analysis, this article will seek to simplify these categories and provide you with the information that you need to know.

Financial Metrics

Whilst many organisations simplify the evaluation of their success down to purely profit and loss, when it comes to marketing the landscape is a lot more complex. Financial metrics such as ROI, Customer Value, Profit Margin and Profit Contribution are great indicators that can be used to justify or dispel the investment in marketing activities, and can form the basis of an evaluation, however, they can be misleading, for example, ROI measures on a percentage basis not on a total sum, therefore a campaign generating a low ROI can potentially make significantly more than one with a High ROI (Piketty, Goldhammer & Ganser 2014).

Behavioral Metrics

Looking at behavioral metrics allows us to look not just at if a marketing activity is working, but how such results are being achieved. The application and interpretation of metrics such as sales totals, market penetration, purchase frequency and my favorite; market share, are crucial in explaining how an organisation is generating their profits, and what areas can be improved. Market Share to me is a universal representation of whether a marketing campaign is working that can be applied to all profit-based organisations, and should always be considered as a KPI (Lautman & Pauwels 2013)

Memory Metrics

Memory Metrics are a unique form of evaluation which can provide organisations with valuable information regarding the perception of their brand. Brand Awareness, Brand Image, Consumer Attitude and Intention to buy are all key indicators in this category. This category would best be described as a great supplement to a marketing evaluation strategy, as the information alone doesn’t provide satisfactory detail, but in conjunction with other metrics can go a long way to providing detail relevant to analyzing the marketing performance of the brand.

Physical Availability Metrics

These factors look at the positioning of the product in a tangible sense, to analyze the presence that the product has at the point of sale. These factors include, shelf space, the hours of operation at supplier, geographical distribution of product and quite simply the quantity of distributors. These factors provide insight into the front-line reasons as to why a product may or may need be performing as expected. Like market share, shelf space and tangible distribution of the product can be a key point of competitive advantage for many brands, particularly in the retail context (West, Ford & Ibrahim 2015).

Market Activity Metrics

These metrics take a broader view of the overall marketing strategy as a whole. Such considerations are of vital importance to provide insight into the efficiency and effectiveness of the marketing activities being undertaken to ensure the prolonged success and constant rejuvenation of the marketing activities being undertaken.

Customer Profile Metrics

The final category of Marketing Metrics relates specifically to the process of profiling the customer base of the brand. These factors generally relate to demographics and allow the brand to get a strong perception of who their customers really are. This is exceptionally powerful in enabling marketers to make informed decisions with a clear target in mind, subsequently mitigating a significant amount of risk throughout the marketing process (Sadgrove 2016).

In summary, Marketing Metrics are a vital component in developing a marketing strategy, and should never be overlooked. The ability to both critically and accurately evaluate a marketing program, empowers brands to improve themselves and strengthen their position in a competitive market. Conversely, the risks associated with not adequately evaluating marketing activities or depending exclusively on profit-based figures can be significant, with a rapid decline in market share the likely outcome. Simply, knowledge is power and the more information a brand can provide themselves with, the more sustainably effective they will be moving forward.


REFERENCES

Lautman, MR & Pauwels, K 2013, ‘Identifying Metrics That Matter: What Are the Real Key Performance Indicators (KPIs) That Drive Consumer Behavior?’, GfK Marketing Intelligence Review, vol. 5, no. 2, pp. 46-52.


Piketty, T, Goldhammer, A & Ganser, L 2014, ‘Capital in the twenty-first century’.


Sadgrove, K 2016, The complete guide to business risk management, Routledge.


West, D, Ford, J & Ibrahim, E 2015, Strategic marketing: creating competitive advantage, Oxford University Press.


Harrison Shannon-Brown

IS APPLE REALLY SUCCESSFUL ?


MARKETING METRICS

Marketing metrics is a measurement system that quantifies the state and active traits.

It is used in both business and research to define objective, to measure the process and to give feedback on process for those change is required.  Good marketing has become a need of the moment so marketing metrics sometimes become priority for the firms as it evaluates the marketing strategies and gives competitive advantage to the firm(Milichovský and Šimberová, 2015).

Traditionally, financial expression or marketing mix elements were focused. However, in this modern world the classification of marketing metrics has changed. As, non-financial metrics are included which is used to evaluate effectiveness in the customer area(Milichovský and Šimberová, 2015).

APPLE’S AND MARKETING METRICS

Marketing metrics tell the current stand of company on various different things related to a company.

Source: (Thomas, 2015).

Source: (Thomas, 2015).

MEMORY METRIC

Apple has been successful in following lot of things that come under memory metrics such as brand awareness, customer’s intention to buy(Milichovský and Šimberová, 2015).

Apple wasn’t a success initially but it has made some right decisions which has made what it is at the moment. Their aim was not only to lead competitors in sales but they wanted market itself and they have made a trend for other devices to follow.

They have done enough engineering on their products and innovations that has made their products iPhone and iMac. The brand awareness of the apple products is so strong that the products of its competitors are compared with it. Apple products have made a distinctive brand image in the market as people don’t buy a smartphone, they but an iPhone. They don’t but MP3 players, they buy and iPod(Anon, 2016).

The intention of people to buy an iPhone is known to everyone as apple has one of the most die-hard fan base of their products and are crazy for it to buy. As recently a man flew from Bangkok to Australia to buy the latest release of apple, iPhone7(Mail Online, 2016).


PHYSICAL AVAILABILITY

Apple’s distribution channel and its easy availability is crucial factor behind its success. It sells its products online through its site. Moreover, it has its own apple stores and other intermediaries for selling its product and making it physically available for purchase. Apple stores opening and closing times vary in different countries according to the countries business hours. Apple had 463 apple stores in the year 2015 in approximate 19 countries of the world(Statista, 2016).

Apple stores have only apple products for sale so its own products occupy all the shelf space for display in the store.

However, it has deals with telecom companies such as Vodafone, AT&T and also the shopkeepers, wholesalers, retailers sell Apple products. The brand image and demand makes it necessary for apple’s intermediaries to display apple products properly in their shops.


CUSTOMER PROFILE METRICS

Apple emphases on marketing their products to people with few different traits. The main target of apple is on the upper and middle class as they their products are expensive and people of these categories are willing to pay more for better experience.

As apple believes in innovation and constantly improve their technology so the age group that apple mainly focuses on is between 18-34 as they love playing with technology.

Source: (Bajarin, 2015).

Source: (Bajarin, 2015).

Apple products like iPods and iTunes are loved by music enthusiasts as they easily compatible with its other products. People that work in media and design form a large segment of its buyers, due to the high-end technology of apple products.

Apple has always had good marketing strategy and has known about its customer needs and how they buy products. In 2012 apple decided to expand its business in India, China and other developing countries. As “grey market” became very famous and consumers were buying more products from authorized re-sellers. apple’s interest in these countries increased due to the increasing middle class in India and China(Johnson et al., 2012).

Chinese consumers were willing to buy Apple products even at higher prices. Moreover, apple knows that it has consumer base in diverse countries and they have to face language barriers to sell their product. Therefore, their iPhone’s come with a voice recognition software called Siri in different languages(Johnson et al., 2012).


MARKETING ACTIVITY

Apple has always focused on their marketing activities and they have tried different marketing techniques and have been successful in it. Apple marketing strategy give it an edge over its competitors as know what makes their customers excited and focuses on the same. Unlike, other company’s apple conveys that it cares about customers’ lifestyle rather than talking about features and products(Johnson et al., 2012).

They advertise their products in such a way to make that it appeals the people to have a better lifestyle. Apple comes out with a new product once or twice in a year and it is very difficult for every company to make their every product a big success. Apple supports its product launch with a heavy marketing campaign which ultimately result in the generation of large amount of sales(Johnson et al., 2012).


REFERENCES

Anon, (2016). What 7 Key Strategies Must We Learn From Apple Marketing?. [online] Available at: https://blog.kissmetrics.com/7-strategies-apple-marketing/ [Accessed 26 Sep. 2016].

Bajarin, B. (2015). Analyzing Apple Watch Satisfaction. [online] Recode. Available at: http://www.recode.net/2015/7/21/11614888/analyzing-apple-watch-satisfaction [Accessed 26 Sep. 2016].

Johnson, K., Li, Y., Phan, H., Singer, J. and Trinh, H. (2012). The Innovative Success that is Apple, Inc. 418.

Mail Online. (2016). Apple fan travelled from Thailand to Sydney to buy the iPhone 7. [online] Available at: http://www.dailymail.co.uk/news/article-3792354/Is-dedicated-Apple-fan-world-Man-flew-Bangkok-Sydney-sat-rain-18-hours-buy-new-iPhone-7.html [Accessed 25 Sep. 2016].

Milichovský, F. and Šimberová, I. (2015). Marketing effectiveness: Metrics for effective strategic marketing. Engineering Economics, 26(2).

Statista. (2016). Number of Apple stores worldwide 2015 | Statista. [online] Available at: https://www.statista.com/statistics/273480/number-of-apple-stores-worldwide-since-2005/ [Accessed 25 Sep. 2016].

Thomas, M. (2015). Apple brand loyalty. [online] E P O. Available at: http://www.e-p-o.org/apple-brand-loyalty/ [Accessed 26 Sep. 2016].


NAME: ARJIT BHALLA

STUDENT ID: 216178845

NPS at PHILIPS

philips

Sara Sahraeean | 216313955

Philips: Do I need to use metrics to understand my customers?

Have you ever been a marketing researcher or a marketing manager? If so, you might have been in situations where you were supposed to answer questions regarding customers behaviour, firm’s profitability, company’s market share, to name but a few. In order to answer such questions marketers need objective measures to quantify various activities of a firm and this can be done through marketing metrics. Concerning this, in this weblog we are going to see why and how businesses use marketing (evaluation) metrics. As an example, we examine how and why Philips uses marketing metrics to improve the quality of its customer care centre and customer satisfaction.

What is a Marketing Metric?

As Kotler (2009) notes metrics refer to the set of measures that can help marketers and firms to quantify, compare and understand their marketing performance. Marketing metrics as a tool box help marketers with monitoring performance of a business from different angles: from the consumer, to the sales force, to the ever-changing media environment. Customers are one of the most important elements of all businesses without which companies have no income, no profit and therefore no market value. Now in order to continuously track and observe customers and ensure the healthiness of the customer base, scholars have developed relevant  customer metrics, based on which marketers can measure how customers  are performing, and how satisfied and profitable they are (Gupta & Zeithaml, 2006).

What is the Net Promoter Score (NPS)?

As Roos and Gustafsson (2007) note, these days competitive markets have made firms to turn their eyes to retention practices. Regarding this, one primary firm-customer performance measure to control is ‘customer satisfaction’. Previous studies suggest that satisfied customers show a high level of loyalty to the brand and are more likely to recommend the brand to others(Parasuraman, Zeithaml, & Berry, 1988; Taylor & Baker, 1994). In order for a company to have control of levels of satisfaction of customers, the first step is to measure customers’ satisfaction. Concerning this, a popular metric to help marketers in pursuing this goal is NPS (Net Promoter Score). NPS is a marketing metric that can show the degree of which customers will recommend products, services or company to the other people and also can be considered as a proxy for customer satisfaction and loyalty (Bendle, Farris, Pfeifer, & Reibstein, 2016).

In order to calculate this metric, companies conduct a survey and ask their customers (on a ten-point scale) how likely they are to recommend the product, brand or company to their family or colleague (Bendle et al., 2016). “A company’s net promoter score is the difference between the proportion of customer placing themselves at points 9 or 10 (called Promoters) and the proportion of customer placing themselves between 0 and 6 (called detractors’). Respondents on scale point7 and 8 called ‘neutrals” (Schneider, Berent, Thomas, & Krosnick, 2008). If companies calculate the numbers of 9s and 10s, then deduct the number of 6s or bellows, the result you get is a company’s Net Promoter Score. The result of NPS is related to customer behaviour and business outcomes.

NPS Construction is:

“Net Promoter Score(I) = Percentage of Promoters(%) – Percentage of Detractors (%)”(Bendle et al., 2016).


Why and how Philips use Net Promoter score?

Philips is a Dutch technology company which was established in Eindhoven in 1981, with its focus on electronics area. Philips is one of the biggest electronics companies in the world. Philips Electronics as a $33 billion business, performs in three individual sectors namely: health care, consumer lifestyle, and lighting.

For a company of Philips’ size, it is really important to have a good sense of what customers are thinking about the products and services they receive. Hence, Philips puts NPS at the centre of its management processes. The choice of NPS for Philips is mainly because of its close ties to retention and company’s income.

The company uses NPS to measure its customer satisfaction and find ways to improve the quality of its products and services. For Philips NPS is something even beyond just a metric to measure satisfaction and has become a source of action as well.  For instance, as a results of the survey to measure NPS Philips noticed some issues around their customer service. The complaints were mainly about Philips not giving customer service during weekends. In response, the company decided to improve its service at customer care centre, by providing service on weekends. The effect of this action was quickly reflected in the next NPS measurement where customers reacted positively leaded to an increase in the number of prompters.

It is also interesting to know that Philips’ strategy in using NPS is not to delight its customers. Their goal is not on how they can delight their customers, in fact Philips just wants to do better than the competitors. Philips goal is that to be in the leadership position vis-à-vis its competitors in all its lines of business.

REFRENCES:

Bendle, N. T. a., Farris, P., Pfeifer, P. E., & Reibstein, D. J. (2016). Marketing metrics : the manager’s guide to measuring marketing performance: Upper Saddle River, New Jersey : Pearson Education, Inc., [2016]

Third edition.

Gupta, S., & Zeithaml, V. (2006). Customer Metrics and Their Impact on Financial Performance. Marketing Science, 25(6), 718-739.

Kotler, P. (2009). Marketing management: A south Asian perspective: Pearson Education India.

Parasuraman, A., Zeithaml, V. A., & Berry, L. L. (1988). Servqual. Journal of Retailing, 64(1), 12-40.

Roos, I., & Gustafsson, A. (2007). Understanding frequent switching patterns. Journal of service research, 10(1), 93-108.

Schneider, D., Berent, M., Thomas, R., & Krosnick, J. (2008). Measuring Customer Satisfaction and Loyalty: Improving the ‘Net-Promoter’Score. In Poster presented at the Annual Meeting of the American Association for Public Opinion Research, New Orleans, Louisiana).

Taylor, S. A., & Baker, T. L. (1994). An assessment of the relationship between service quality and customer satisfaction in the formation of consumers’ purchase intentions. Journal of Retailing, 70(2), 163-178.

Marketing Metrics Matter

In the present business world, thriving for success and profits is an extreme challenge, exceptional marketing is no accident it is result of precise execution and planning ,but how marketers know which marketing strategy is well fit for the organisation ?

At this stage the marketing metrics come’s in to play. Organisational managers use a wide range of marketing metrics to measure and evaluate the performance of the brand in the market.

What is a Metric?

A Metric is a measuring system that qualifies a trend , dynamic or a characteristic(Farris, P.  2015).

The metric has become a measurable indicator to improve quality level, quantity or financial categories. (Kerzner, 2011) describes the metric as a numerical measure (usually in financial units) representing a part of business data in a specific area.

Why do we need it ? 

The marketing metric has become a measurement system, quantifying dynamic and/or static characteristics. In both business and research, marketing metrics include defining objectives, measuring the degree of completion and providing the feedback on processes subject to change. In general, metrics are considered as a standard of measurement and they are used as a corresponding benchmark (Farris et al., 2010; Peters et al., 2013; Ahi & Searcy, 2015)

“I often say that when you can measure what you are speaking about, and express it in numbers, you know something about it; but when you cannot express it in numbers, your knowledge is of a meagre and unsatisfactory kind; it may be the beginning of knowledge, but you have scarcely, in your thoughts, advanced to the stage of science, whatever the matter may be”. (Lord Kevin 1994)

By far from many years the numerical fluency has been playing very crucial role in the business and helped the managers to quantify the market opportunities and competitive threats.

marketing-metrics

Image -1

The above image shows the marketing financial and non-financial metrics.

Financial Metrics

Profitable sales are the ultimate aim of any organisational marketing campaign. Companies use financial metrics to measure sales revenues, minimize overhead expenses, maximizing gross margins and managing investments to appropriate risk and expected returns (Lenskold, 2003).Amazon which is known for its innovative marketing strategy has surged it profits to 107 billion us dollars. Below image shows the net profits of the company from 2004 to 2015

Amazon which is known for its innovative marketing strategy has surged it profits to 107 billion us dollars. Below image shows the net profits of the company from 2004 to 2015

266282

Source (statista)

Innovative marketing campaign gave a rise in sales and good returns for the stakeholders .

Behavioural metrics and Memory metrics

The behavioural metrics consist of Sales of the brand, Share of the brand in the market, Market penetration, and Purchase frequency, Share of the category requirements.

Where in memory metrics mostly focused on brand and its awareness and to what extent is customer satisfied with the brand?

Marketing mastermind Red bull an Austria-based energy drinks company created market for energy drinks. Red bulls market share is shown in the image below.

redbull-energy-drink-11-728

Social media platform used by Red bull to win the market, Red bull strategically marketed its brand by sponsoring sporting events and owning the sporting teams. Continuous marketing of brand through the television media and digital media gave Red bull a cutting edge over its competitors.

In 2015 Red bull sold about 5.9 billion cans sold worldwide with a soaring sales profit of 15.5% increase from EUR 5.110 billion to EUR 5.903 billion

Physical Availability Metrics 

In any given business availability of services and products to customers increases the sale and increases the market share, the most important factor of a company is to find the way to reach to the customers. The supermarket giant Countdown unveils $500m expansion plan for next few years.

Countdowns Click and Collect strategy  serves 80,000 customers daily and receiving around 20,000 (New Zealand Herald) online orders weekly. Online shopping strategy gave a cutting edge on sales over its competitors.

Marketing activity and Consumer profile metrics

Companies should keep a track on its marketing activities to know the progress of activities. From a business perspective view ,it’s important for any organisations to know the customer well.

Sporting brand Addidas uses dashboards to know analyse brnad engangment with its customers through various social media.

02_adidas_dashboard_commbuzz1280x1024 03_adidas_dashboard_socstats1280x1024 adidas_new1

References 

http://Rust, R, Ambler, T, Carpenter, G, Kumar, V, & Srivastava, R 2004, ‘Measuring Marketing Productivity: Current Knowledge and Future Directions’, Journal Of Marketing, 68, 4, pp. 76-89, Business Source Complete, EBSCOhost, viewed 25 September 2016.

Milichovsky, F, & Simberova, I 2015, ‘Marketing Effectiveness: Metrics for Effective Strategic Marketing’, Engineering Economics, 26, 2, pp. 211-219, Business Source Complete, EBSCOhost, viewed 26 September 2016.

https://books.google.com.au/books?id=klVoCgAAQBAJ&dq=what+is+a+metric+in+marketing&source=gbs_navlinks_s

https://business.linkedin.com/marketing-solutions/blog/7/75-quotes-to-inspire-marketing-greatness

https://www.google.com.au/search?espv=2&rlz=1C1RLNS_enIN694IN694&biw=1517&bih=654&tbm=isch&sa=1&q=marketing+metrics+farris&oq=marketing+metrics+farris&gs_l=img.3…24933.26670.0.26860.0.0.0.0.0.0.0.0..0.0….0…1c.1.64.img..0.0.0.WVtqEKzEvgs#imgrc=L13PzIOHkKXysM%3A

http://energydrink.redbull.com/company

http://www.scoop.co.nz/stories/BU1609/S00831/grocery-collection-points-at-key-transport-facilities.htm

http://www.stuff.co.nz/business/industries/80301842/Countdown-brings-in-click-and-collect-at-all-its-supermarkets

Krishna Chittimalla (216326017)

kchittim@deakin.edu.au


Is there any constant marketing evaluation taking place in Toyota?

As we all know that Toyota is a Japanese car maker headquartered in Toyota, Aichi, Japan. Toyota is the world’s first car producer to create more than ten million vehicles for each year. From July 2014, Toyota was considered as the biggest recorded organization in Japan by market capitalization and by income. The Toyota was established by Kiichiro Toyoda in 1937, as a spinoff from his dad’s organization Toyota industries to make cars.

Marketing of Toyota

Toyota holds a greater position in automobile business. They have greater business influence in North America, Asia and Europe. North America is the biggest single business sector for Toyota, representing around 33 percent of it’s worldwide solidified vehicle deals in financial year 2016. The organization sold 2.8 million vehicle units in North America amid the financial year. While Toyota has been facing a minor stoppage in its other key markets like Japan, Asia and Europe for the last few years. But North America has stayed solid in its Toyota automobile business. There was a higher demand for SUV,s in North America which increased the deals and incomes of Toyota in North America. RAV4 and Lexus NX played a major part in developing their sales and incomes.

Toyota also has a solid item portfolio in Asian nations like Indonesia, Malaysia, Taiwan, Philippines and  India. In the latest financial year ended on March 2016, the organization’s vehicle deals in Asia remained at 1.3 million units, representing 16 percent of it’s worldwide merged vehicle deals. In Europe, the organization’s automobile deals totaled around 0.84 million units. Russia is also included in the European automobile deals. There was a decline in the European automobile deals, because of the diminished market deals in Russia.

Analyzing Recent Trends in Toyota’s Revenue

Source: Google Images

On looking at Toyota’s income or revenue side, in the financial year 2016 which is from 1st April 2015 to 31st March 2016, Toyota recorded solid incomes of 28.4 trillion Japanese yen, which is 3.4 percent greater than it’s of 27.2 trillion Japanese yen in the financial year 2015. From the above bar graph we can understand that, since financial year 2010, Toyota’s incomes have developed by half. While the organization’s income of North America has expanded by 90 percent amid this period. Moreover the tendency in Toyota’s income from Asia demonstrates hopefulness with a 63 % expansion since financial year 2010. The positive development in North America’s automobile deals was essentially determined by a sharp recuperation in auto request in the US after the 2008-2009 economic dilemma. In Asia, developments in India’s and China’s auto market, has helped the organization to build it’s income from the district. Toyota’s North American income and monetary benefits additionally promoted by the late short coming in the Japanese yen against the US dollar.

The marketing mix used by Toyota consists of 4P,s namely product mix, place or distribution in Toyota’s marketing mix, promotional mix and pricing strategy.  Toyota uses these marketing metrics to completely satisfy their customers. Even for the ordinary people, can afford Toyota’s autos like Camry, Corolla and so on. Toyota has a different arrangement of items. This component of advertising blend distinguishes authoritative yields for the objective clients. The resulting are the product offerings in Toyota’s item blend Toyota vehicles, Lexus vehicles, Welcab arrangement, Marine items, Save parts and frill, Motors. Toyota autos are the most well known in this item blend. Lexus autos are extravagance items from the organization. Then again, the Welcab arrangement are Toyota cars altered for the elderly and individuals with handicaps. The organization additionally makes yachts, motors, and extra parts for vehicles and marine items. This a player in the advertising blend demonstrates that Toyota achieves a more extensive market and diminishes market-based dangers through a differing item blend.

Dealers and retailers play a major role in Toyota’s distribution in market mix.Toyota dealerships are the place most deals exchanges happen. After all, a few retailers like auto supply stores additionally offer the organization’s items, for example, spare parts and frill. This a player in the showcasing blend demonstrates that Toyota depends vigorously on dealerships to offer its items to the objective business sector.

Personal selling, advertising, public relations,  sales promotion and direct selling plays an active role in Toyota’s promotion. Personal selling is basically focused on potential purchasers, the firm utilizes various medias like T.V. radio, newspapers, magazines and so on for encouraging it’s business. Moreover,  the firm advances its items through advertising, for example, the Toyota TogetherGreen program that backings ecological activities, and the Meal Per Hour program that gives nourishment to Food Bank. These advertising exercises make a positive brand picture for Toyota. Toyota uses two methods of pricing such as market oriented pricing and value based pricing.Toyota utilizes the market-oriented pricing to decide costs in light of economic situations and the costs of contenders. This valuing methodology is eminent in most by far of Toyota items, for example, cars and trucks. Though, the firm additionally utilizes the quality based pricing procedure, which sets costs taking into account the real and saw estimation of the item. The organization utilizes esteem based valuing for top of the line or more costly items, for example, the Prius and Lexus autos. This a player in Toyota’s advertising blend demonstrates that the organization decides value levels in view of economic situations and clients’ observations.

Username:  edwinpeter12345678

References:

1.   http://panmore.com/toyota-marketing-mix-4ps-analysis

2.   http://marketrealist.com/2016/05/toyota-plan-deal-challenges/


Vodafone’s Internet of Things

To know how successful we are in our business, it is necessary to know our position in the market. To monitor and track our position market metrics are used. There are various types of metrics, usually companies will use mostly combination of some of those and statistical methods to monitor their current position in the market.

The “internet of things(IoT)” is current crucial way to do business. Internet of things is connecting every physical device to internet using software, sensors and mobile network etc. to move, collect and exchange data. Driverless cars, smart metering for gas and electricity and remote monitoring of houses are some of the examples helped by IoT. Some surveys still saying that IoT’s real value is not measured yet but adopters and executives are accepting the importance of IoT in their organisations to gain competitive advantages.

Vodafone is one of the largest telecommunications provider in the world. Vodafone provides voice, messages, data and fixed broadband services. Recently, few months back Vodafone released some findings to know the experience of business leaders with the internet of things to monitor their return on investments on Internet of Things.

There is so much of positive impact of IoT on every industry in the world. 74 percent of all adopters of IoT indicated that IoT is providing their organisations to meet their key requirements. Almost 5 billion devices are connected to networks in this year as per the estimate of recent finding. So managing those devices will be the most focused task for the coming years.

Vodafone Group IoT director Erik Brenneis said : “ three quarters of the companies we interviewed now recognise that the Internet of Things is a new industrial revolution that will change how people work and live forever, and almost half of the companies surveyed across multiple countries and sectors told us they’re already planning to bring connected network intelligence to millions of devices and processes over the next two years. 2016 is the years of Internet of Things entered the main stream.”

260x238-world-map

Now you may get a question like how Vodafone is related to this?

As Vodafone has presence in the most parts of the world independently or through their subsidiary partners with other networks, they are providing solutions to the all devices to get connected with internet. It is main aim of Internet of Things. As this IoT is becoming main focus of major business leaders Vodafone is making commitments with them to provide internet to them.

Vodafone launched global sim to enable and support IoT infrastructure. It will be helpful to access and control your things all over the world. Vodafone global sim is available now over 200 countries in the world. Depending on the people’s need Vodafone is providing various solutions to the customers as end to end solutions, providing single control point for all IoT connections with assured quality by arranging service level agreements. Vodafone global enterprise is the service provider for multi-national customers. It saw a revenue growth of 29 percent in the last one year. The total number of connections with Vodafone has reached to 38 million which is an increase of 37%. Vodafone also providing connectivity devices to capture more on value chain to increase more accessibility for the machinery.

The customers of Internet of Things were 20.2 million in 2014, 27.8 in 2015 and 38 million in 2016. These numbers shows the growth in the company evaluation. It is creating 28% of total revenue of Vodafone.  Vodafone is estimating that 38 million customers are mostly connected directly with Vodafone to reduce the emissions to create a safe to work place. Greenhouse gas emission per petabyte of data by Vodafone mobile networks was 3,100 tonnes in 2015 and 1,900 tonnes in 2016. Vodafone is investing more money on expansion of IoT connectivity platform to 20 more countries now as it is creating a service revenue of 5%.  Now Vodafone is expecting 8.5 billion overall customers by 2020 as IoT is going to give boost for the telecommunication industry.

The marketing evaluation strategy of Vodafone is to increase sale number by knowing the customer response on their product. The major return on investment to Vodafone is user payments as it is a service provider. Vodafone is expanding their business with help of partners and making some more agreements with other providers all over the world, it is the investments made by Vodafone in one way.

Vodafone is expanding their global business level value by observing the total sales or revenue, taking suggestions from the clients, by making promotional activities, by checking sales rate. Vodafone used to provide only mobile to mobile communications but by the new innovations and expanding into global market they are also providing all Internet of Thing services. By expanding like this now it has become one of the leading network in the world.

Internet of Things is the next biggest thing for the businesses in Australia.

References:

Anon, (2016). [online] Available at: http://images.response.vodafoneglobalenterprise.com/Web/VodafoneGroupPLC/%7Bb08802f4-efca-4cb3-8644-33e342483117%7D_Vodafone_IoT_Barometer_2016_Infographic.pdf

Internetofthingsagenda.techtarget.com. (2016). Maturing business models and the ROI of IoT – IoT Agenda. [online] Available at: http://internetofthingsagenda.techtarget.com/blog/IoT-Agenda/Maturing-business-models-and-the-ROI-of-IoT

Vodafone.com. (2016). Vodafone News Releases. [online] Available at: http://www.vodafone.com/business/press-releases?year=2016

Vodafone.com. (2016). Internet of Things (IoT) | Vodafone IoT. [online] Available at: http://www.vodafone.com/business/iot


By

Sri Mahesh J

215405163

ONE BRAND APPROACH ACROSS THE GLOBE: COKE’S ‘TASTE THE FEELING’ CAMPAIGN

According Jain & Griffith (2011) as per latest trends in the field of business, most organizations find themselves operating in a very competitive and harsh business environment, most of them under the circumstance try and gain a positive image over their rivals via the means of an effective global marketing strategy.

Marketing evaluation allows firms to find out whether or not the marketing strategy for their products and services is working for their firm, not only that it is also beneficial with regards to formulating the best possible marketing strategy as per need of the hour (Lamb et al. 2008). Marketing metrics like financial metric, customer profile matric, memory metric and others are the measures which are helpful in effective marketing evaluation in order to interpret, quantify and compare several marketing activities.

image3

(Source: Coca Cola)

Now a day food and drinks industry is facing many challenges, one of it is over-consumption of sugar. In order to tackle the issue of changing consumer behavior Coca Cola came up with their global strategy of one brand with different variants having the tag line ‘Taste the Feeling’. Adopting this approach Coke intended to unify all its product offerings under one brand, also at the same time the company intended to sell its products to different customers as per their taste’s, requirements, lifestyles etc.

Focusing on the memory metrics for example brand awareness, brand image, customer satisfaction etc. with this one brand strategy Coca Cola intended to create a brand image in consumers mind that whichever variety of Coke they are consuming, it’s not about the different varieties but it is about the ‘Feeling’ which customers will enjoy. Chief Marketing Officer of Coke de Quinto during the unveiling of the ‘One Brand Approach’ has stressed on the fact that the company intends to sell Coke as a brand that is for everybody, no matter which brand people are having it’s all about ‘Taste the Feeling’ (Hanlon 2016). In support Segal-Horn & Faulkner 2016 point out towards the fact that more and more multinationals are standardizing their brand in order to take advantage of media opportunities by promoting one brand, similar packaging and consistent positioning in different markets, It allows them to stay away from complications related to localization of products, also at the same time create a effective global brand image.

Source: YouTube

Where the sales diet coke and coke zero had declined from £444.4m to £428.6m and £93.2m to £92.7m respectively, this global strategy has had a positive effects on their revenue growth(Roderick 2016).

(Source: YouTube)

Coke as a brand is trying to create an image in customers mindset whereby they view the brand as something which they can relate too. It is all about pleasure which people get after drinking coke. The company in short wanted to let people know that they not only love the brand but also the product simultaneously. During the release of this campaign the CMO highlighted the same fact by mentioning that the huge brand image of Coke lies in the fact that its products are simple pleasure, the more humble they will be, the more bigger they would become as a brand (Moye 2016)

In order to achieve the objectives of one global brand approach Coke had launched several ads which showcase the different moments where people from different sections of the society (Race, Color, Religion etc) are seen enjoying coke as a part of daily life. Also the ad campaign captured different situations like first love, kiss, and date etc whereby central to each of the themes is people enjoying the situation over a bottle of Coke. Along with the same the company in other ad campaigns has included sounds like people enjoying Coke, opening of the can etc. to captivate the attention of audiences and give them a feel of the pleasure they would experience whilst drinking Coke (Staff 2o16). In short the company has tried to convey to its customers what is it that they want them to view Coke as a brand and a product. Wells 2014 mentions that ad campaigns should be designed for the sole purpose of conveying to the customers as to how the company wants them to view their products and also how they view it as a brand.

However on the other hand in some countries like Kenya the national censor board objected to scenes of kissing and hugging by stating that the same is unsuitable for family viewing (Mahr 2016). Customer profile matrics inclusive of gender, age, race etc. helped Coca Cola to overcome this issue. The company chose ten ads that they would broadcast globally; those ads had been carefully chosen in a way that they do not hurt the sentiments of people from different Religions, Culture, Race etc.(Balakrishnan 2016).

image2image1


  (Source: YouTube)

All in all it can be concluded from the above that Coke’s ‘One Brand’ marketing strategy not only helped the company enhance its already established brand image, but also at the same time create an iconic image of its products in consumers mind. Even though as per reports the Cola industry has a seen a decline in sales over the past 11 years as a result of people opting for healthier options (fortune.com 2016), yet the creation of single brand has worked and will work for Coke in the long run.

WordPress ID: pimpaleprutha

Name: Prutha Pimpale

Student ID: 215221879

References:

Jain, S & Griffith, D 2011, Handbook of Research in International Marketing, 2nd Edition, Edward Elgar Publishing Inc, Massachusetts, USA

Lamb, C, Hair, J & McDaniel, C 2009, Essentials of Marketing, 6th Edition, Cengage Learning Inc, Ohio, USA

Moye 2016, ‘One Brand Strategy, New Global Campaign Unite Coca-Cola Trademark, CocaCola Journey, retrieved on 25th September 2016, <http://www.coca-colacompany.com/stories/taste-the-feeling-launch>

Horn, S & Faulkner, D 2010, Understanding Global Strategy, Cengage Learning, Zrinski, Croatia

Wells, W 2014, Measuring Advertising Effectiveness, Psychology Press, New York, USA

Mahr, K 2016, ‘Kissing in Coca-Cola advert ‘violates family values’, says Kenya’s film regulator’, The Telegraph, 13th April, retrieved on 25th September 2016, <http://www.telegraph.co.uk/news/2016/04/13/kissing-in-coca-cola-advert-violates-family-values-says-kenyas-f/>

Balakrishnan, R 2016, ‘From ‘Open Happiness’ to ‘Taste the Feeling’ : Why Coca-Cola changed its strategy’, The Economic Times, 3rd February, retrieved on 25th September 2016, <http://economictimes.indiatimes.com/magazines/brand-equity/from-open-happiness-to-taste-the-feeling-why-coca-cola-changed-its-strategy/articleshow/50820028.cms>

Fortune 2016, Soda Consumption Falls to 30- Year Low In The U.S, Fortune, retrieved on 25th September 2016, <http://fortune.com/2016/03/29/soda-sales-drop-11th-year/>

Roderick 2016, Can Coca-Cola’s One Brand marketing strategy help sales pop?, Marketing Week, retrieved on 25th September 2016, <https://www.marketingweek.com/2016/01/20/can-coca-colas-one-brand-strategy-help-sales-pop/>

Anthem 2016, video recording, Youtube, Australia

CocaCola Brotherly Love #TasteTheFeeling 2016, video recording, Youtube, Australia


FASCINATOR + EVALUATIONS ARE REQUIRED!

grc_2016_2o0c0321_sdriscoll_gtselection_01_retouched

It’s that time of the year, spring is in the air and that can only mean one thing… Spring carnivals are here! Your social media strategy is developed and approved, baseline stats have been recorded. You half way through your digital marketing campaign and your boss has asked you to prepare monthly ROI of for the Spring carnival social media campaign.

How do you respond? What do they really want to see?


Too many social media managers fall back on the easy answers: we gained this many new Instagram followers, this many Reposts, this many likes, this many Facebook shares, and so on.

Sure, these social media metrics offer insights into how the campaign is performing or a particular “post” or imagine of content performed, but will they show your boss and executives how your efforts are helping boost the bottom line.

Activity based marketing evaluation is fine a can provide some fantastic assessments on how the strategy is performing. But technology allows to step things up a notch so that the social media analytics will better reflect and explain how all your hard work is paying off. How giving up your Saturday to approve that Instagram post is really increasing the companies brand awareness.

What if your marketing strategy is not efficient and you are not reaching to the target market?

How will you get to know that where you are lacking?

One answer for all these questions is Marketing Evaluation. In order to evaluate or calculate your marketing, study of marketing evaluation provides multiple tools and a marketing matrix is one of them. A marketing mix helps a company to measure market through quantifying, comparing and interpreting the market data.

eva

Ultimately, evaluating your social media strategy is very accessible and an important process to see real results.

7 tips for Social Media evaluation to include from Sarah Dawley that will aid in explaining and expanding activity based analysis to operational based digital analysis:

  1. Don’t just track link clicks, track click-through with bounce rate.
  2. Don’t just track web referrals, track share of traffic driven.
  3. Don’t just track mentions, track social share of voice.
  4. Don’t just track comments, track conversation rate
  5. Don’t just track shares, track amplification rate
  6. Don’t just track likes, track applause rate
  7. Don’t just track numbers, track leads

The key to tracking and evaluating a marketing is ensuring your leads are the links you share have shared & that they are trackable within your marketing automation or analytical software.

Marketing Evaluation is not a hard or demanding thing. With your online footprint statics and data are always available and present, it is just about finding out and displaying exactly what you need to. Being able to identify what did and did not work, what target publics were reached, who were not. The costs associated with the campaign and the overall outcomes. The strengths and weakness, future opportunities and what threats may be present for the next time. Looking into regression analysis, what your publics di? What do they intend to do? From your evaluation and you predict what they are going to do?


Including al of this in your Marketing Evaluation and your ROI for you boss during your spring carinval social media planner will ensure you are readily able to track, identify, and evaluate your marketing campaign.

Refernces:


CAMSoft Experts (2016) Social media marketing with Facebook and Twitter: 026 evaluating post frequency. Available at: https://youtu.be/qHidk9YSC1Q (Accessed: 26 September 2016).

International, B. 2 B. (2016) Regression analysis in market research. Available at: https://www.google.com.au/url?sa=t&rct=j&q=&esrc=s&source=web&cd=3&cad=rja&uact=8&ved=0ahUKEwj_kefFgq3PAhXEFZQKHSXwDwcQFggsMAI&url=https%3A%2F%2Fwww.b2binternational.com%2Fresearch%2Fmethods%2Fpricing-research%2Fregression-analysis%2F&usg=AFQjCNG-X0vd6DjucE51AFy76xfwC-E4vQ (Accessed: 26 September 2016).

InstruxionAE (2011) What is marketing ROI? Explania.com. Available at: https://youtu.be/1vRx5TYTmYs (Accessed: 26 September 2016).

Return on investment (ROI) (2016) Available at: http://www.investinganswers.com/financial-dictionary/technical-analysis/return-investment-roi-1100 (Accessed: 26 September 2016).

Sterne, J. (2010) Social media metrics: How to measure and optimize your marketing investment. Available at: https://books.google.com.au/books?hl=en&lr=&id=OkkZhB2Yw7IC&oi=fnd&pg=PR10&dq=social+media+metrics&ots=1Fk1yxNLD2&sig=VJ9RQQJCIIO1dM0uHfxyJUVFiTs#v=onepage&q=social%20media%20metrics&f=false (Accessed: 26 September 2016).

Victoria, R. (2016) Country racing Victoria – Geelong. Available at: http://www.grc.com.au (Accessed: 26 September 2016).

Wintor, J. (2014) 7 powerful methods to improve your business Bottomline. Available at: https://www.optimizesmart.com/7-powerful-methods-improve-business-bottomline/ (Accessed: 26 September 2016).

What is a marketing mix? Definition and meaning (2016) in Available at: http://www.businessdictionary.com/definition/marketing-mix.html (Accessed: 26 September 2016).

Chloe McIntosh, ID: 210671252


Flybuys and their Marketing Metrics

What are marketing metrics?

There is a classic saying, “you can’t manage what you can’t measure”, so when it comes to marketing how do we measure our success or failure of various marketing campaigns. The best way to measure marketing performance is with the use of marketing metrics. But what exactly are marketing metrics? Marketing metrics are specific set of measures that are used by marketing professionals to compare, quantify and interpret marketing performance. One of the main reasons marketers need to use these types of measures is to prove their worth to various stakeholders as marketing is seen as an expense rather than an investment … but as another classic saying states “you’ve got to spend money to make money.” An article by Tim Ambler and John Roberts states that companies should avoid only using one financial measure the “silver metric” and should use multiple measure to assess marketing performance.

So what are the different types of marketing metrics that we can use to assess marketing performance?

  • Memory metrics – looks at brand awareness, brand image associations, mental availability, attitude, customer satisfaction, intention to buy and recommendation
  • Behavioural metrics – looks at sales, market share, market penetration, purchase frequency and share of category requirements
  • Financial metrics – looks at various measures such as profit contribution, profit margin, return on investment and customer value.
  • Customer profile metrics – looks at various things such as age, gender, income this kind of information is useful for marketers to understand more about customers
  • Physical availability metrics – looks at how easy and readily available products are to buy and consume. This particular metric can be measured in many ways such are distribution, opening hours, number of displays in a store and geographical coverage

These various metrics help marketers accurately assess their marketing performance and can be used to help future marketing strategies.

Flybuys

flybuys-fancy-logo-2b7d7535

Loyalty programs have been used for years and years, the benefits of providing loyalty programs are, to attract new customers, to increase the amount of money that customers are spending and to retain customer.

One of Australia’s most popular programs is Flybuys. With many participating partners such as Coles, Kmart, Target and Liquor land. Customers can swipe their Flybuys card at various retailers around Australia earning points and rewards with the money spent and goods purchased at these various stores. Customers are able to earn points with other Coles products such as insurance and credit cards. But other than being a great incentive for customers what good is a loyalty program such as Flybuys for everyone else?

For starters these kinds of loyalty programs collect huge amounts of customer data that can be used by marketers. By swiping your loyalty card with every transaction at various participating stores marketers are able to track everything that customers are purchasing and therefore they are able to market particular offers and products to the right people … for instance their would be no point in marketing baby care products to elderly customers with no young children, this would just be a waste of marketing money and resources. By being able to use and collect this data marketers are also able to assess consumer behaviour and customer profiles. Marketers can also use these loyalty programs to request feedback from customers about their experience in particular store and feedback on particular products.

Loyalty programs like Flybuys are a great asset to companies, research has shown that food retailers have found that 65 per cent to 95 per cent of their sales go to members of these various loyalty programs, and that the greatest value of these programs is being able to identify individual customers and also identify their individual behaviour. This benefit of a loyalty will no doubt out way the cost of providing such a service, especially as consumer behaviour can be so mind boggling to many marketers out there.

It is fair to say that loyalty programs can provide marketers with plenty of information about their marketing performance, these particular data bases can tell marketers so much about how the company is performing and provide vast amounts of insight to consumer behaviour.

Eleanor Wilson #210669831


References

Ambler, T, Roberts, JH, 2008 Assessing marketing performance: Don’t settle for a silver metric Journal of Marketing Management, vol.24, 733-750

Coles, 2016, Collect Points, Coles, 26th September 2016, <https://www.flybuys.com.au/collect/#/&gt;

CRM Trends, 2016, Loyalty Programs, CRM Trends, 26th September 2016, <http://www.crmtrends.com/loyalty.html&gt;