Marketing Metrics, A must add-ins in the future of the marketing activities.

With the introduction of the term metric, and with the technological development in the measuring system, companies are using various tools to evaluate their performance. Evaluating is a key to figure out what needs to be improved, and to stay on the same ground to that of the performance of the company. Marketers are using various metric tools not just to demonstrate its accountability but also to improve and enhance the intangible benefits, they provide to the companies and ensures they meet their performance goals. During economic downturns, the companies are prone to reduce the marketing budgets, the performance indicator tools helps to measure the degree to which the marketing spending contributes to the bottom line and its contribution to the other areas of the organization, sales and customer service for example.

F1.large.jpgKotler (2003) listed four types of marketing control, which states whether the company is effective in achieving the selected goals, making or losing money, and efficiently generating returns from the marketing expenditure, thus summarizing the four types under the head: annual-plan, profitability, efficiency and strategy and having done that, it is important to compare the four types individually and in a group using the marketing metrics. As per Clark, Abela, & Ambler, 2005, marketing functions may address a threat to its future, and during the time of economic uncertainty if the demand for the accountability and measurement is not addressed.

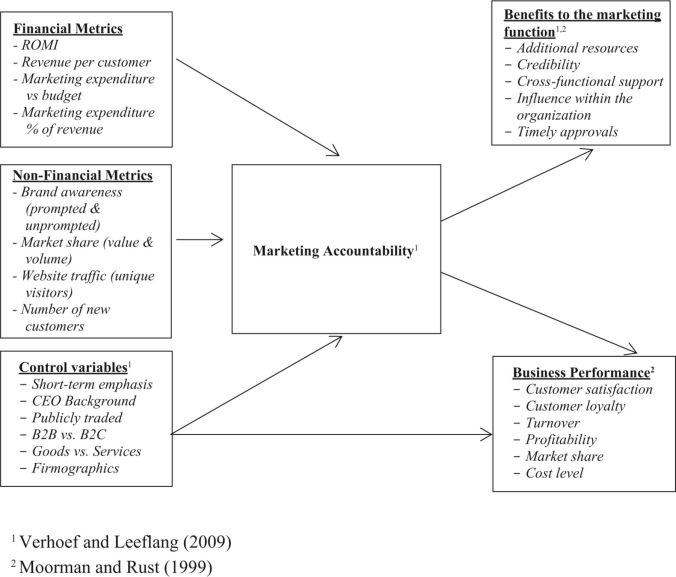
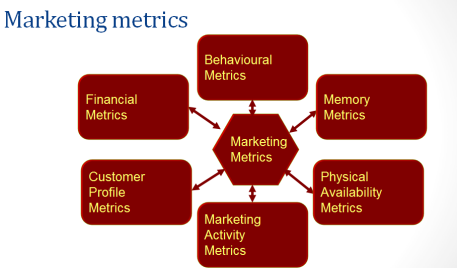
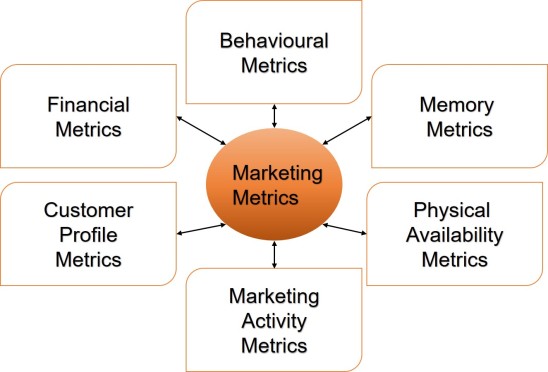
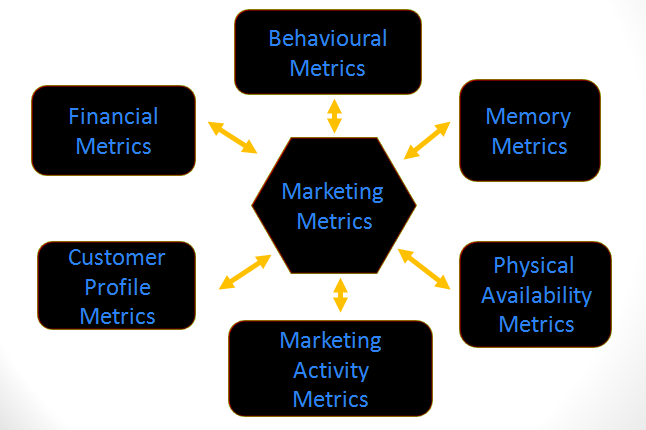
Marketing functions and activities can have a longer effect on the performance of the company and may not be recorded in the single financial year report. Hence the measure for marketing performance splits between, financial measures and those who incorporates non-financial measures. Discussion by Clark (2001) and Ambler (2003), suggested that marketing is not short of metrics and evaluation processes; Farris, Bendle, Pfeifier, and Reibstein (2004) identified 114 metrics that covers both financial and non-financial metrics, but lacks structural usage of the available matrices. Summarizing the huge list of metrics, Ambler, Kokkinaki and Puntoni (2004) categorized the marketing metrics, covering their top 15 metrics under (a) consumer attitudes, (b) consumer behavior, (c) trade customers (d) relative to competitors (e) innovation, and (f) accounting.

Financial Metrics can be used to measure the performance of the organization’s outcomes and identified as (a) return on investment (ROI), (b) revenue per customer, (c) marketing expenditure vs budget, and (d) marketing expenditure as a percentage of revenue. The main focus of these metrics is to provide a quantitative measure, and link the marketing activities to the company’s finances.

Marketing functions addresses directly or indirectly to the wide range of other organizational functions and needs to be evaluated regularly, and needs to be linked closely to the non-financial marketing evaluation metrics. This qualitative measurement of the market functions are the indicators of the future performance of the organization. It is accountable under four measures namely (a) brand awareness, (b) market share (volume and value), (c) website traffic (number of unique visitors) and (d) the number of new customers.

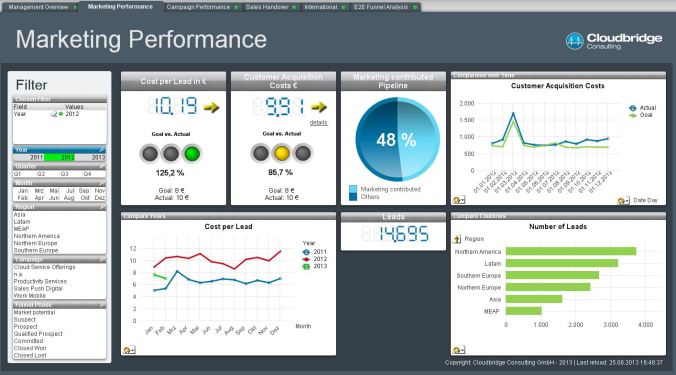
These two variables and sub-variables can be collected together in the form of the charts, data and templates to suit the requirement of the organization for further analysis of the growth and measure, defined by the marketing dashboard, which keeps the track of all measurable aspects of the organization. Typically, it categorizes the metrics results under the following categories: (a) customers, (b) product, (c) brand, (d) channels, (e) efficiency, (f) organizational development; and environment (micro-environment), helping the organization to allocate the resources in a better way and enhance the performance. With the development of the marketing accountability and creation of dashboard, business analyst can make a fact based decisions, developing a competitive advantage. Businesses are embracing performance management as a vital role in estimating organization’s bottom line, with marketing being one of the final frontiers for the business’s performance as it’s a key to any of the company ‘survival.

cloudbridge marketing dashboard marketing performance.jpg

In future, if we expect marketing activities to survive the economic downturn, we need to arm the marketing mix with the marketing performance tools, or KPI (key performance indicator) and link qualitative and quantitative data to out space the growing competition in the market.

Marketing metrics…where to start

Briarne Boyd

Student Number :ID: 216046983


In the current economic climate it is vital that an business is not only competitive but is able to analyse how through their marketing campaign they are competitive. As outlined by Iacobucci (2014) “you cant manage what you don’t measure”, this being said the potential for companies to analyse its strengths and weaknesses as well as those of its competitors is significant. With the development of IT and social media the indicators which can be measured is vast. Companies want to be assured that what they are spending on marketing is having a positive effect on their business.

This being said where does a company start with metrics? The metrics a company utilises need to be applicable to the specific company to enable effective analysis and strategy planning to enable the company to benefit. Potential metrics a company can utilise moves beyond the dollars and cents of a company and can be classified into these main categories:

  • financial metrics
  • behavioral metrics
  • memory metrics
  • physical ability metrics
  • marketing activity metrics
  • customer profile metrics.

With the evolution of IT the development of computerised marketing dashboards has increased. In previous years companies compared metrics and outcomes manually but in recent times the development of dashboards has flooded the marketplace. A dashboard enables a company to develop what metrics it chooses to illustrate, demonstrate and visualise in an attempt to analyse the company and highlight areas needing improvement.

According to Lavinsky (2103) ,the 2 main issues when developing a dashboard for a company are recognising what metrics to track and building an appropriate dashboard. Iacobucci (2014) suggests measures that include:

  • “Financial :Sales, profits
  • Marketing:Share, customer satisfaction, average prices charges
  • HR: Employee Satisfaction, low turnover
  • Operations: Lean, mean, green, customer pleasing machine”

So clearly the development of a dashboard has significant investment and given the those in charge of companies want to maximise profit and minimise overheads what is the benefit of dashboards?

It is possible to apply a dashboard to any company. Currently, a state government has developed a dashboard so not only the management can analyse metrics of the organisation but the entire community can also analyse the organisation to determine if they want to “buy” into it – or actually attend the service.

http://www.sahealth.sa.gov.au/wps/wcm/connect/public+content/sa+health+internet/about+us/our+performance/our+hospital+dashboards/about+the+ed+dashboard/emergency+department+dashboard

The SA health dashboard gives customers an up to date profile on the public emergency departments within metropolitan Adelaide. It enables customers / patients to identify what KPI is important to them, if a bed is important, if a wait in emergency is important, if they require mental health versus surgical intervention. This dashboard enables executives of SA health to identify which department is under the most pressure at a specific time, if it is cyclic or it is specific to one hospital.

The dashboard also could be seen to have negative elements – when the emergency departments are in crisis or at capacity, consumers may be discouraged to attend, the effectiveness of a department are available for all to see – which may attract negative attention from social media, political opinions and also detrimental or negative media attention.

Levinski (2013) outlines 5 benefits of dashboards – all of which the SA health achieves these include:

  • Visibility- the dashboard gives insight and everyone is aware of the current aspects of the emergency departments
  • Ongoing Improvements – enables executives to constantly measure performance and as defined previously ‘you cant manage what you can’ measure’
  • Time saving – it is automated and up to date and in real time
  • Judge performance against your plan – SA health have specific emergency KPI’s, some of which are highlighted on the dashboard enabling consumers and executives to measure performance
  • Employee performance improvements – when employees can see their performance and are aware others can see their performance they will attempt to meet the KPI’s and various goals set

Overall, marketing metrics are vital for companies to recognise their performance but also provide a starting point for more advance analysis of a company and its performance.


Reference List

Iacobucci, D (2014) MM4 – student edition

Levinski, D (2013) http://www.forbes.com/sites/davelavinsky/2013/09/06/executive-dashboards-what-they-are-why-every-business-needs-one/#5ad4b1b27568

http://www.sahealth.sa.gov.au/wps/wcm/connect/public+content/sa+health+internet/about+us/our+performance/our+hospital+dashboards/about+the+ed+dashboard/emergency+department+dashboard

Maggi’s New Flavours – Launched in New Style

Place and distribution strategy

The approach used and the process involved by a company to distribute their items or service to the consumer is known as place strategy in marketing mix. The customer must get the product at the right place and at a right time. Efficient and effective distribution is significant when an organisation plans to achieve the overall marketing objectives. The turnover will be at stake if the market demand is taken for granted.

A small video presentation for the is same is here.
Source: (YouTube, 2016)

Distribution channel members comprises of manufacturers, wholesalers, retailers, consumers, etc.

And this channel has been designed involving various combinations of these channel members. There a three types of channels viz. intensive distribution, selective distribution and exclusive distribution
Analysis for Nestlé’s Channels of Distribution:

Retail: It is a distribution centre for a number of products in a particular warehouse or other specialised set up or a store to cater directly to the customers at their nearest vicinity. These, stores could be a general store, a super market or a convenience store.

Online: with the facility of buying products from internet the companies are adapting online marketing for easy and effortless consumer experience, and many other benefits that the customer gets from buying from the internet.zchtplaceindirectSource:(Yorku.ca, 2016)

Nestle has introduced new flavours under Maggi Hot heads specifically for young adults. The product being in a snack industry under the fast-moving consumer goods (FMCG) nestle has naturally opted for intensive distribution. Intensive distribution generally goes with heavy promotion, acute prices, with many products.


hotheads
Source: (Anon, 2016)

Intensive Distribution deals with the distribution of products priced low or compulsive purchases. Nestle India Ltd. Nestle had announced the launch across India of the fresh variants of Maggi instant noodles. Nestle abides by the FMCG strategy of distributing that engages rupturing the volume.  And particularly they have launched the product in a combo deal with an online marketplace retailer namely SnapDeal.


Details of Design Strategy used by Nestle:

Push and Pull strategy make it easy for the flow of products from the suppliers to the manufacturers and ultimately to the end consumer.

Pull Strategy: Nestle induces the customer by offering customers to pull products from the channel. They achieve this by heavily advertising their products to the customers, and by offering discounts or promotional offers or coupons or rebates, etc. Nestle has made a promotional offer on the online launch of Maggi hot heads brands by giving combo packs at discounted prices. From last 5 years nestle has spent each year a $48M USD to $70M USD on advertising and sales, More on this.

The significant benefits of using pull strategy is that it gives the organisation an opportunity to have a direct contact with the customers. Receive an instant payment since the customers do not have a term loan or grace days to payment, instead make an online or in shop at the cashier. The company have more room for margin since the intermediaries’ spot is now vacated. It facilitates the customers to come up with new ideas (Smart Insights, 2013).For disadvantages I’d refer you to this blog.

Push Strategy: Distribution partners are induced by nestle to push the products through the channel. They capitalise it by offering incentives to the sales force, advertising partners, price discounts and offer allowances for marketing activities. However, if there is a major retailer or a supermarket the then the problem of home brands replacing the established product arises.

As markets, the environment and customers are open to change it’s best to use a combination of both strategies.

internet-distribution


But by far the best distribution till date is online distribution. The benefits are endless and growing. Thus, the companies must place the product by understanding the customers needs and develop a strategy for the most effective distribution channels and allocate resources across channel options.

I Hope you enjoyed thoroughly!!
Compliments and Feedback will be highly appreciated!!

Thanks,
Dhaval Salla


Refrences


Anon, (2016). [online] Available at: http://i.ndtvimg.com/i/2016-06/hot-heads-on-snapdeal-625_625x437_61466746308.jpg [Accessed 26 Sep. 2016].

Yorku.ca. (2016). [online] Available at: http://www.yorku.ca/lripley/zchtplaceindirect.jpg [Accessed 26 Sep. 2016].

lacobucci, D. (2014). marketing management. 4th ed. mason: cenage learning.

YouTube. (2016). Marketing Mix: Place Strategies. [online] Available at: https://www.youtube.com/watch?v=r2JJYyeKOkk [Accessed 26 Sep. 2016].

oppewal, H., tojib, D. and Louvieris, P. (2013). experimental analysis of consumer channel-mix ue. journal of business research, pp.66 (11), 2226-2233.

Smart Insights. (2013). The Push and Pull product distribution model – Smart Insights Digital Marketing Advice. [online] Available at: http://www.smartinsights.com/marketing-planning/marketing-models/push-pull-product-distribution-model/ [Accessed 26 Sep. 2016].

Measuring campaign effectiveness made easy

reporting

Marketing activity effectiveness is often assessed on a narrow set of criteria and therefore does not quantify adequate information to indicate brand and business performance.

The complete picture of marketing evaluation relates to the conceptual model on how well an organization’s marketing mix activities are performing compared to its financial goals.

The chart below covers the main information required to evaluate as overall strategy for marketing activity whether it be traditional advertising, direct to customer, social media, new product development, pricing, sales force activity, distribution, pr/sponsorship, and general metrics.

Although marketing metrics have different indicators than financial metrics, the ultimate goal should be the same.

marketing-metrics-chart

Financial Metrics are about representing profit in response to meeting customers needs. The success should not be based on one silver number or the highest number.

The American marketing Association defines to marketing accountability being:

“The responsibility for the systematic management of marketing resources and processes to achieve measurable gains in return on marketing investment and increased marketing efficiency while maintaining quality and increase value of the corporation”

How to measure your financial effectiveness of marketing activity?

Using three basic criteria a corporation can measure its financial performance.

Profit contribution – the appropriate measurement of the sales response versus the direct cost or marketing investment of an activity. Marketing measurement should tell the organization how well it executes both short and long term activities, how it builds brand equity and creates shareholder wealth. 

Profit Margin – metrics need to be compared with the plan and prior period to understand trajectory of firm performance and be reviewed to see whether there is variation is due to the quality of performance or quality of plan.

Return on Investment or ROI is the measure of efficiency and effectiveness. ROI is important but can also be counterproductive – as it is difficult to measure one off returns for ongoing marketing campaigns. For example magazine advertising in attracting new customers.  If measuring ROI based on spend in various media channels such as advertising it is important to allocate the results according to the exact activity. For example it could be the introduction of a new flavor or packaging rather than advertising a product in a catalogue that results in an increase of financial performance.  EQUALLY IMPORTANT to look at the comparison to old data also.

Finally Customer Lifetime Value or CLTV – is the profit a firm earns from each customer – also known as customer equity and depends on how long a customer remains with the firm; – this measure is increased by raising retention rate, extend the customer life, increasing sales to customer.

Can you change your behavior?

Customer behavior analysis is an important marketing effectiveness measure rather than customer profitability. Also known as behavioural metrics. The firm can either encourage or influence consumer behaviour by changing pricing or other financial activities.

Coles supermarkets overhauled its approach to promotions to drive sales and profits for both themselves and their vendors. In 1990 they increased the discount level on certain categories to up to 10% off the shelf price. Through a pilot program in some Victorian stores, and the use of scan data and promotional history  for particular target categories. The objective was to create promotional plans that would increase sales and profit.  Through examples of Behavioural metrics such as sales – no of units sold, the proportion of market share, purchase frequency, share of category requirements, defection rate, customer complaints and recommendations.

The comparison of competitors products and the analysis of sales movement depending on the discount offered per category/product is important in determining whether the increase in sales came from other brands and if so which brands. 

The table below illustrates whether the promotion has provided the best results. Coles attempted to analyse the effectiveness of promotions by plotting the sales promotion vs the sales increase. Discounts below 10% and above 20% produce the best results.

marketing-analysis

A comparison of Coles vs Aldi and other grocery retailer’s market share comparison shows that margins have been driven lower in the industry, due to the latter’s arrival in Australia.  The rate of expansion along with the increase in marketing expenditure has affected the main players.

Market Share Analysis

Shoppers are also less loyal to a brand which, and value is the key driver to their behaviour – resulting in retailers to lower their prices by approximately 1.5 %  – Aldi Market share is now at 12.1% and Coles is at 37.3% (Roy Morgan Data).

Market Penetration

Proportion of product sold in category – Multiples command around 70% of all packaged grocery sales and have little opportunity to share growth in that category.

Purchase Frequency and Category Requirements

In an average four hour week period, 5.3 million customers shop at Aldi, and 10 million at Coles, and out of these shoppers 37% visited at least one Coles store.

Do you remember my brand?

Memory Metrics – relate to brand awareness, brand image association

In recent times Coles image has lead over Woolworths in savings across various brands. In June 2015, customers associated value-add in the Coles vs Aldi Shopping basket of over $100 per week.  Most shoppers are guided by price and offer. If customers perceive your brand as too big and not putting in an effort they will go elsewhere, and in this case to the likes of Coles and Aldi.

“I think Aldi is the cheapest, second is Coles for value and last is Woolworths” customer statement.

graph

Customer Brand Preference Survey

Choice’s Consumer Pulse Survey in March showed that 75 per cent of Australians were concerned about grocery expenses and value for money was a top priority. A market price survey released this month showed that shoppers could save about 50 per cent on their weekly bill by foregoing leading brands at Coles and Woolworths.

For the purpose of this analysis – physical availability metrics will be brief and  making a brand easy to notice and buy as possible. – Coles has physical and digital channels of distribution – with approximately 776 supermarkets in Australia. The brands available a numerous across private label and supplier lines.

Customer profile metrics

Customer profile metrics identify customer geometric criteria such as their gender, age or income. Retailers find it important to target buyers based on set where they live, who their buyers are, how, when and where they shop.

Advertising both through digital and social media have different marketing metrics than for example price promotions.  Email campaigns are measured by open rates and click rates.  To ensure a campaign is successful the comparison should be how your open rate vs the industry average click rate.

click-rates

Other internet reports such as banners and tiles on website are measured by click through rate, post log in purchases but are also measured via overall sales data units post and during the promotional period.

Sales force data and CRM databases help collect data so that leads can be captured and recorded for follow up targeting.

Marketers now need to be involved in the marketing mix decision making, and market growth is often associated with economic growth.

why-shoppers-are-turning-to-coles-and-aldi-over-woolworths

KATHY TOURGELIS

Student ID: 212243981

REFERENCES:

frank.chung@news.com.au – Business Retail: Moody’s rings Aldi alarm bell for Coles, Woolies, April 22, 2016.

Mintz, Currim – What Drives Managerial Use of Marketing and Financial Metrics – Journal of Marketing Volume 77 (March 2013), 17-40

Wyner G, Do Financial Metrics Stifle Marketing Creativity – MM November/December, 2008

Ambler.T, Roberts J, Assessing Marketing Performance don’t settle for silver metric, Journal of Marketing Management, 2008, Vol 24, No 7-8, pp 733-750.

Clark B, Ambler T, Managing the Marketing Metrics Portfolio – Marketing Management, Fall 2011, 16-21

Gielens K, Drivers of Consumer Acceptance of packaged goods – International Journal of Research in Marketing. 24, (2007) 97-111.

Kembrey, M – Why Shoppers are turning to Coles and Aldi over Woolworths, The Sydney Morning Herald, Business Day, June 18, 2015.

Kennedy C, The Promotion side, Progressive Grocer, Sept 1993, 72: ABI inform collection, page 40.

Let’s measure our marketing performance– multidimensionality is key!

Well, there you are, sitting in your little office behind your laptop staring at a bunch of data. Managers need to know how their business is performing. And managers need to know how their brand is performing. Short: they want to know their brands value. That’s when marketers come into play and to report the marketing performance  part of the company’s brand value. Using marketing metrics as a measurement tool helps to stay on top of things and reveal weak spots that need to be improved – according to the motto: what can’t be measured, can’t be managed. In that progress marketing metrics focus on a variety of different areas including finances, customers and brand awareness. Lamest (2016) even pictures them as lens through which data is approached, convert it into information and finally into knowledge that can lead to important decision-making.

marketing-metrics

While facing the task of deciding what metric suits the company’s goals best, Ambler and Roberts (2008) state, that a single silver metric is not geared to provide an adequate rendering of its situation. Instead multidimensionality is supposed to be key for a comprehensive analysis of the company’s performance. According to that, they recommend the use of as many metrics as there are goals of the company. Alright, that solves the problem of picking just one particular metric but causes the challenge of paying attention to the whole picture.

Digital marketing metrics

One thing that should not be disregarded in that context are online or digital marketing metrics. Especially with regard to the everlasting discussion of whether marketing activities are expenses or an investment, the demand for cheap and efficient solutions is high. Digital marketing metrics are a useful tool for all kind of online content that is provided by the company, e.g. websites, videos and campaigns. Having said that, it is important to note, that these digital metrics serve as an indicator especially with regards to the behavioural, memory and customer metrics.

Basic metrics

Basic metrics generally cover everything regarding the consumption, e.g. how many visited the website or viewed the video. Please not that quantity does not necessarily refer to quality which is why especially page views are normally seen as a sole vanity metric, however reflecting the company’s popularity. Apart from that, platforms like Google Analytics can help to track the location of customers and the channels they used in order to adapt the current strategies.

Engagement metrics

Apart from the “normal” basic metrics that give a quick overview about the who, what, when and where, it is interesting for a company how long the customer is dealing with the specific content. Especially with regards to customer loyalty as part of the behavioural metrics. In that context e.g. social media is very helpful with its options to comment, retweet or share contents.

digital-marketing-channel-converted

Source: SMstudy 2016


Click here to read more about the top 10 online marketing measures you need to take into account when running a website.

Missing the forest for the trees

Since it is hard to measure the effectiveness of a digital content it is even more important to spend time on setting objectives before starting to create for example the new video for the campaign. It is easier to decide whether something is successful when you can pit the objective against the actual result. Surely, there are multiple metrics that should actually help measuring the company’s performance but quite often lead to confusion and overextension instead. Whereas Ambler and Roberts (2008) support having a set of metrics, I suppose organisation is the real no. 1 when it comes to marketing evaluation. Nevertheless, I agree that there cannot be a single ultimate metric that suits every company.

So , what does it tell us? Measuring the company’s or brand’s value is not easy and can get quite overwhelming. Even though digital marketing metrics do not tide over the fact that several metrics are needed to create a proper overall picture, they still facilitate the calculation, comparison and interpretation of the marketing performance.

 While multidimensionality is the key to achieve a profound impression of the marketing performance, it is even more important to keep track of the variety of metrics and put them together to the one individual measurement tool that suits your needs best! 

posted by Ronja Naudorf (rnaudorf -215466308)

References

Ambler, T, Roberts, JH 2008, ‘Assessing marketing performance: don’t settle for a silver metric’, JournaSl of Marketing Management, vol. 24, issue 7-8, pp. 733-750, doi: 10.1362/026725708X345498.

Lamest, M 2016, ‘The Role of Marketing Metrics and Financial metrics in Guiding Top-level Management’, doctoral colloquium paper, School of Business. Trinity College, Dublin, retrieved 26 September 2016, <https://marketing.conference-services.net/resources/327/2958/pdf/AM2012_0352_paper.pdf>.

SMstudy 2016, Digital marketing, image, retrieved 26 September 2016, <https://www.smstudy.com/Article/Importance-of-understanding-and-evaluating-Digital-Marketing-Channels>.

Marketing Evaluation of Apple


Apple is the major brand in the technology industry in relation to its profit generated and ranking of its brand. Apple has satisfied many people years after years with its products like Macbook, Iphone, Ipad, Iwatch, Ipod, Itunes and many more.

Apple always targets three main segments. As apple is the most premium brand it usually uses lifestyle segmentation. The urban population which has sufficient purchasing power for buying apple products generally comes this segment. These are people who are early users in life but now the brand image of Apple like that even laggards have started using the products.

download-1

There are three target groups in Marketing strategy of Apple:

  1. People who love music are targeted by Apple Ipod and Itunes.
  2. Irrespective of age, people are targeted for Apple Iphone, Macbook, Tablets and many more things.
  3. Products like Apple TV and Apple Iwatch also targeted many people.

As apple being on top there is no doubt that when people talk about smart gadgets, the first thing that comes to their mind is the Apple.

Mac is designed by Apple, they are the finest computers in the world with software like OS, iLife and iWork. With its iPods and Itunes apple is on top in the field of music. Apple iPhones and tablets describes the future of mobile media.

Apple has gained many advantages over its competitors:

  1. Products with higher technology ­– its only of software like OS, Macbook and Iwatch have leaded the market space.
  2. Brand Image – Apple is being on top years after years and well known for its brand image.
  3. Profit gained over time – apple make high profits dues to its high profit margins.
  4. Research and Development – The biggest advantage that Apple has gained from competitors is that spending of research and development keeps their eye on the future instead of focusing on the present.

14965-10909-canaccordgenuitysmartphoneprofitshare-l

Apple have generally faced very less competition in the market. Ipad faces competition from Samsung tablets, Apple Iphones faces tough competition from Android phones and  Macbook faces its competition from Dell.

The genuine services offered by Apple like itunes also has its competitors like online music players. Ibooks faces tough competition from Amazon. However, Iwatch holds the market share but its competitors and also rising like Samsung gear.


marketing-strategy-of-apple-inc-bcg-matrix

The BCG matrix of Apple is divided into four parts:

  1. The Cash cows are the products which are standing from the starting and have no completion as per the present market situations. Products like Mac, Iphones, Iwatch and Itunes have 50% of their market share in the year of 2015.
  2. The stars are referred to Ipad and Ibooks because these two products have to face lot of competition and to being on top position Apple has to invest a lot.
  3. The question mark referred to Apple TV which generally have least market share and it can be possible that it might grow with certain speed in future.
  4. The dog is referred to Ipod because no doubt its market share is high but now it is speedily decreasing as smartphones have took place of Ipods.

Apple has arranged its retailing in a very smart way. In US there are around 450 stores. In these stores rather than selling the product and packing the product for customers they help them and gives them comfort with apple products.

In 2016 Apple has the maximum brand equity in the world and also achieved top position as a brand in the world. The brand worth of Apple is 118.9 billion dollars. To reach at this much level the brand has struggled a lot and it the power and ability to its products successful one after one and to reach to the entire world with the best products. Apple has reached to the highest brand equity one of the reasons is that they are outstanding marketing communications.

Apple advertises if products in a very stylish way as it is visible from any of its print ads like in newspaper or magazines. Apple flash their message in a very clear way with white background and splash of colors on the printed ad while introducing the product or differentiating the product.

download

That is why this is the main strength of this brand. Not only the print ads, even the video ads also do the same.

The publicity that Apple does cannot be ignored and this publicity goes on till the product turns into achievement.

The brand Apple can make others marketers to learn from them with respect to differentiation, building brand image and the most important of all “Innovation”.


References:

Bhasin, H. (2016). Marketing Strategy of Apple Inc – Apple Marketing strategy. [online] Marketing91.com. Available at: http://www.marketing91.com/marketing-strategy-apple/ [Accessed 26 Sep. 2016].

YouTube. (2016). Steve Jobs on Market Research m4v ff avi ff. [online] Available at: https://www.youtube.com/watch?v=2U3w5Blv0Lg [Accessed 26 Sep. 2016].


   Name– Nilesh Khaitan

Student ID– 215429315

Unit: Mpk732 (Marketing Management)

Submitted to: Dr Nichola Robertson

Due date: 26/09/2016


What are marketing metrics?

A company want to well operate their business can use marketing metric to measure the influence of their business. Marketing metric can be characterized as a “framework that evaluates a pattern, dynamic or trademark. It can analyze causes and venture future occasions (Farris 2010:1). The marketing metric has turned into an estimation framework, whether in both business and examination, marketing metrics incorporate characterizing goals, measuring the level of consummation and giving the criticism on procedures subject to change. In addition, marketing metrics are considered as a standard of estimation and they are utilized as a relating benchmark (Milichovsky & Simberova, 2015).

Marketing metrics include six measurement method, financial metrics, behavioral metrics, memory metrics, physical availability metrics, marketing activity metrics, and customer profile metrics.

  1. Financial metrics:

In any business campaign, there is a definitive point to produce beneficial deals. Shareholders, steward and advertisers anticipate that organization will amplify benefits to have most elevated profit for their speculations. For this organization use financial metrics to quantify deals incomes, minimize overhead costs, expanding gross edges and overseeing ventures to suitable hazard and expected returns (Lenskold, 2003).

Figure 1

 mmf2

HTC, is a smartphone company, according to the measurement (figure 1) can find out that during 2014 to 2015, revenue and operate profit have a slight change. In 2014 Q4 (NT$47.9 billion) the revenue was high but in 2015 Q2 decreased to NT$33.0 billion. In 2014 Q4 to 2015 Q2 the gross margin also decline to 19.3%. Therefore, through the measurement results HTC can make adjustments to their marketing plan, and apply financial metrics to increase company profit.

  1. Behavioral metrics

Behavioral metrics consist of sale, market share, market penetration, purchase frequency, share of category requirements, solely loyal customers, defection rate, and customer complaints and recommendations. In the other word, it have to consider how many unit did company sell? How much market share does company hold? How often do clients purchase? (Sharp, 2013).

  1. Memory metrics

Memory metrics portray data that buyers have in their recollections in connection to a product or a brand. In addition, this measurement include brand awareness, brand image associations, mental availability, attitude, customer satisfaction and service quality, and Intention to buy a brand in the future (Sharp, 2013).

There is an example for behavior metric and memory metric:

Nowadays smartphones are popular all around the world, and is an important communication tools for people to use. Following will shows that which brand and type of phone for clients are willing to buy.

Figure 2

 mmb1

Figure3

mmb2

Resource for figure 2 & 3: Zach, 2016

According to figure 2 & 3 can find out that in 2015 and 2016 Q1 Samsung’s market share is the highest, which means for clients Samsung is the most popular brand in the market. The second place is Apple. In addition, the result from the figure 3 points out android system is more popular then ios system. Therefore, it can clearly show that Samsung is the top brand in smart phone.

Apple vs. Samsung: A Battle Bigger Than Your Phone

This video is compare between Samsung and Apple, and also have an investigation point out that Samsung is the most popular brand for clients.

  1. Physical availability metrics

Physical availability implies making a brand as simple to notice and purchase as would be prudent, for as many clients as possible. It incorporates more than retail infiltration and incorporates hours of accessibility, and simplicity of encouraging the buy. Following physical availability metric include: Number of distribution points, Hours of opening, and Geographical coverage of distribution points, Geographical coverage of delivery points, Number of display points in store, and Number of shelves devoted to the brand(Sharp, 2013).

Following is an example for Physical availability metrics. Woolworths is one of the big supermarket in Australia. It not only have physical shop provide clients to go shopping. It also provide on-line shop for clients can shop everywhere and it also will deliver to house for you. Therefore, Woolwealth give client easy shopping.

Woolworths Shop Online


  1. Marketing activity metrics

Marketing activity metrics is essential to quantify what advertising exercises the association is really doing. Fundamental for the association to monitor its promoting venture (Sharp, 2013).

  1. Customer profile metrics

Customer profile metrics is for advertisers recognize and achieve the greater part of the distinctive purchasers in a brand’s classification. The measurements incorporate client’s sexual orientation, age or income. What’s more, advertisers need to comprehend who their distinctive purchasers are; the place they live; what media they expend; how, when and where they shop.

Following is an example about customer profile metrics, it use marketing dashboard to identify where smartphone clients are.

Figure 4 mmc

Resource: mobile marketer, 2014

Reference list

Farris, P 2010, Marketing metrics : the definitive guide to measuring marketing performance, Upper Saddle River, N.J. : FT Press, c2010.

Lenskold, J. (2003). Marketing ROI. New York: McGraw-Hill., retrieved 24 September 2016.

Milichovsky, F, & Simberova, I 2015, ‘Marketing Effectiveness: Metrics for Effective Strategic Marketing’, Engineering Economics, vol. 26, no. 2, pp. 211-219., retrieved 24 September 2016.

Sharp, B. (2013), Marketing: Theory, Evidence, and Practice. Oxford University Press, Melbourne, Australia.

Figure:

  1. Chilin C. & Edward W. 2015, “HTC CORPORATION 2Q15 BUSINESS REVIEW”, HTC 2015 investor
  2. Zach E., 2016, Whatever you do, don’t buy these smartphones
  3. Mobile marketer, 2014, U.S. Smartphone Ownership Reaches 71.8 Percent Mobile Market Penetration

Video:

  1. Apple vs. Samsung: A Battle Bigger Than Your: Phonehttps://www.youtube.com/watch?v=cPE-0nV5g0M
  1. Woolworths Shop Online:  https://www.youtube.com/watch?v=w9rIi_lNCJw

By – 214497061

APPLE – MARKETING METRICS

Marketing metrics are a set of performance indicators that allows the business to assess their overall marketing performance over time and help achieve greater accuracy in business activities (Milichovsky & Simberova 2015). The success of a business lies in its marketing abilities (Low, Gao & Mohdari 2016) and marketing plays a significant role in this. The marketing metrics are categorized as Financial, Behavioral, Mental, Memory, Consumer profile and physical availability. Let’s discuss them with respect to Apple Inc.

Founded by Steve Jobs, Apple Inc. based in Cupertino, USA is one of the largest technology company in the world (Chen 2015) and becoming the first US Company to be valued over $700 bn (Higgins, Ciolli & Bost, 2014).

apple

Source – Apple Inc.

Financial Metrics are financial figures derived from financial statements (Chabowski & Hult 2013) that helps a company to determines its market position with respect to its sales, revenues, profit etc. Apples profit margin are poised to decline mainly due to lower sales worrying  the investors considerably (Patrick 2016). This forecast overshadows Apples increased revenue income and puts pressure on them to bow to shareholder anxiety and invest more on their innovation to stem the lowering sales. But overall the huge revenue allows them to focus on new innovations and bringing shareholder satisfaction.

Behavioral Metrics relates to a company’s market penetration, market share, products sold, purchase frequency etc. (Banasiewicz 2013). Apple is losing its market share in PC sales (Meyer 2016) falling behind Lenovo while they face stiff competition from  Samsung who rules in smartphone market share but on the other hand its latest entry Apple Watch is beginning to dominate the smartwatch sector beating competition from Google wear devices and Samsung Gear S2 (Tilley 2016). In terms of market penetration, due to the high price they place on its products, customers flock to their rivals who places lower prices for almost similar specifications. The one area where apple thrives is its ability to retain its customer by promoting greater customer experience with its products.

Memory and Mental Metrics deals with brand awareness, Customer satisfaction etc. Consumers identify themselves with the brand they consume One of the success behind Apple has been the mass following of customers who identifies with Apple brand (Belk & Tumbat, 2005). The company has been able beat its rivals by making the consumers interested and inspired with latest innovations and this has helped in consumers being able to identify with the brand “Apple”. In almost all technology domains the brand name on everyone’s tongue is Apple which leads to higher customer retention, purchase frequency etc. when it comes to customer satisfaction Apple ties with Samsung in the smartphone sector (Oliver 2015) with most Apple consumers happy with the services Apple provides highlighting the importance apple places on its customer satisfaction. Customers fall in love with the sleek finish of Apple products resulting in more customer retention.

A major necessity for brand growth is physical availability of products. This is one area I believe Apple can do more as barring a few stores the availability of Apple products lags behind some of its nearest rivals. A brand stays more in the minds of consumers when it is easily seen and in the select stores where they are available, Apple products are placed in such a manner that they are easily seen by any prospective buyer resulting in more purchases and thus market share.

Consumers are the soul of any company and hence consumer profile metric is very important for any marketer as they help identify their core customer base including the age, income etc. Historically, the Apple brand has been favored by the economically elite section. About 67% of the household owning apple products earn double to non-apple households (Metafacts 2009). This is mainly due to the high price on most products that acts as a deterrent to lower earning households. Also most owners of the Apple products have attained higher education levels. The products find more takers among the youth who like to equate with the style and cool look that Apple epitomizes and to differentiate from the older generations.

A marketing dashboard helps Apple to analyze its customer based performance which over the years they have been able to excel in highlighted by its ability to retain its core customers and also shareholder related measures to keep them satisfied. These when taken together paints a detailed picture about Apple as a whole.

Sudeep Vasudevan

ID – 215387485

username – svasude

References

Banasiewicz, AD 2013, Marketing Database Analytics. [electronic resource] : Transforming Data for Competitive Advantage, Hoboken : Taylor and Francis, 2013.

Belk, R., & Tumbat, G. (2005). The cult of Macintosh. Consumption Markets and Culture, 8, 205–217.

Chabowski, BR & Hult, GTM 2013, ‘EVALUATING COMPETITIVE ADVANTAGE AND PERFORMANCE: HOW DO MARKETING ASSETS AND FINANCIAL METRICS INTERRELATE?’, AMA Winter Educators’ Conference Proceedings, vol. 24, pp. 307-.

Chen, Liyan (May 11, 2015). “The World’s Largest Tech Companies: Apple Beats Samsung, Microsoft, Google”. Forbes.

Higgins, T,  Ciolli, J  & Bost, C 2014, “Apple Inc. market cap tops US$700B, double what it was when Tim Cook took over as CEO”. Financial Post.

Oliver, S 2014. “Apple, Samsung tied for highest smartphone customer satisfaction”

Low, SP, Gao, S & Mohdari, MM 2016, ‘Marketing importance and marketing performance measurement of architecture firms in Singapore: an exploratory study’, Construction Management & Economics, vol. 34, no. 11, pp. 739-50.

Metafacts 2009, “Just how different” and elite are Apple customers – socioeconomically, behaviorally, and attitudinally?

Meyer, D 2016, ‘Apple’s MacBooks Lose Market Share as PC Shipments Decline Again’, Fortune.com, pp. 1-.

Milichovsky, F & Simberova, I 2015, ‘Marketing Effectiveness: Metrics for Effective Strategic Marketing’, Engineering Economics, vol. 26, no. 2, pp. 211-9.

Patrick, S 2016, ‘Another Apple investor concern: Gross margin declines’, Investors Business Daily, p. 00.

Tilley, A 2016, ‘Apple Watch Takes Up More Than Half The Smartwatch Market’, Forbes.com, pp. 2-.

The Marketing World Cup

Coke wins marketing.  Yes, it is a contest, and yes, there are winners and losers.  Coke wins.  Constantly.  There are a few ways we know this, the constant articles about Coca Colas marketing strategies being one of them (see the AdNews article or the BusinessInsider article for examples).  A more data based approach, however, is more useful for any professional use and Forbes ranking of Coca Cola as the 4th most valuable brand is more quantitative in that respect.  Now while that ranking may give some indication of brand recognition and marketing success, it is not specific enough to give any feedback on a single marketing task.  That brings us to Cokes second win.  The World Cup.

coke-world-cup

Yes, for the first time in history, a company has won both marketing and the World Cup.  A world double and a world first.  Now, in fairness, Germany actually won the 2014 World Cup, but Coca Cola won the marketing side of the World Cup, and as it was the second most watched sporting event in history (behind the 2012 Olympics as per BBC), it is a win nonetheless.  In a study done by Millward Brown, they found that 81% of Brits recognized Coke as a World Cup partner, while an even greater 92% of Brazilians did as well.  This is where Coke wins, in being the most recognized World Cup partner, showing just how well their marketing strategy at the World Cup worked.  This data, for Coke in this instance, and in any other corporation as well, is instrumental in being able to judge the success of a marketing strategy or campaign.

This is where marketing metrics come into play.  Marketing metrics are, simply put, measures to quantify the performance of a marketing strategy.  Fortunately, and unfortunately, there are more marketing metrics than necessary, allowing for any number of measures across different aspects of marketing.

Marketing metrics can measure behavior metrics, financial performance, memory metrics (like in Millward Browns study), physical availability metrics, customer profile metrics, amongst others.  For Coke, some of these could possibly be ignored.  Realistically, physical availability is one metric Coke will not have to worry about (when was the last time you were looking to buy a Coke and could not find one?), while the rest are where Coke needs to be wary.

Customer profile metrics and behavioural metrics are two metrics where Coke would need to pay close attention to their performance.  As per Keiningham et al., loyalty and satisfaction metrics can be used to predict customer retention.  In Coca Colas field, specifically colas (as opposed to all of their other products as well), there is a plethora of competitors (see Wikipedia for a questionably accurate and complete list).  With so many competitors, keeping customers is vital.

Financial performance is another that Coca Cola cannot ignore, however, they unsurprisingly have not published that data for me to talk about.  However, it is not hard to understand why knowing how much money is being brought in by a marketing campaign is important.  Obviously, if financial return is high, the marketing campaign is doing well.  If not, some changes may be needed.  Obviously this is a simplistic view but it should provide a little idea of why these particular metrics are needed.

The last type of metric is that of memory, one that Coke has not struggled with in the least.  Between being in the top 5 most valuable and recognizable brands and an incredibly effective marketing campaign at the World Cup, Coke has done well to be both known and remembered by everyone, and Millward Brown’s study just quantifies and proves that (for a more general idea of how well they do in being recognized, walk down the street until you find someone who does not know what Coke is).

coke

While Coke would score well in all of these metrics, Coke is an exception (like I said, they won marketing).  In other companies and corporations, the correct metrics would give managers an idea of where their own marketing shortfalls might be, and from there how to fix them.  I say the correct metric because using the wrong metric could either give useless data, or possibly data that presents a less than accurate picture of the marketing outlook.  That being said, by using the correct metric, and using that data properly, any manager could turn their corporation into the next Coke (though most likely not).


References

Baker, R., 2016. Coca-Cola Makes Biggest Ever Shift To Global Marketing. AdNews. Available at: http://www.adnews.com.au/news/coca-cola-makes-biggest-ever-shift-to-global-marketing [Accessed September 24, 2016].

Anon, Category:Cola brands. Wikipedia. Available at: https://en.wikipedia.org/wiki/category:cola_brands [Accessed September 24, 2016].

Feloni, R., 2016. 7 strategies Coca-Cola used to become one of the world’s most recognisable brands. Business Insider Australia. Available at: http://www.businessinsider.com.au/strategies-coca-cola-used-to-become-an-iconic-brand-2016-2#/#1-it-started-with-a-unique-market-tested-formula-1 [Accessed September 24, 2016].

Keiningham, T. et al., The value of different customer satisfaction and loyalty metrics in predicting customer retention, recommendation, and share-of-wallet. The value of different customer satisfaction and loyalty metrics in predicting customer retention, recommendation, and share-of-wallet. Available at: http://www2.owen.vanderbilt.edu/bruce.cooil/documents/publications/msq2007.pdf [Accessed September 24, 2016].

Slater, M., 2014. Olympics and World Cup are the biggest, but what comes next? BBC Sport. Available at: http://www.bbc.com/sport/30326825 [Accessed September 24, 2016].

Anon, 2016. The World’s Most Valuable Brands. Forbes. Available at: http://www.forbes.com/powerful-brands/list/ [Accessed September 24, 2016].

Walker, S., 2014. Coke wins the World Cup 2014. Kantar UK Insights. Available at: http://uk.kantar.com/business/brands/2014/performance-of-brazil-world-cup-brand-sponsors/ [Accessed September 24, 2016].

Marketing evaluation on ‘COLES’

Well, apparently this company need no introduction, if I ask you, which is the nearest store that comes to your mind if you are running out of groceries? yes, you guessed it right its ‘COLES’. Coles is an Australian supermarket chain owned by west farmers having its stores on more than 1000 locations, with over more than 100,000 employees working under its belt along with an annual revenue of jaw dropping $33 billion.(NewsComAu, 2016) along with its arch rival Woolworth holds around 80% of the Australian market. 

download

What is Marketing Metrics:

There is an old saying ‘we cant measure, what we don’t measure’. Marketing metrics refers to a set of measures or tools to identify, compare and interpret the marketing performance of a company. Be it Coles, Woolworth, Aldi or any other business giant, one would definitely use marketing metrics or marketing evaluation techniques to compare and evaluate the performance and the nature of a brand.Every company follows a set of metrics which helps them to identify whether the goods and services provided by the firm meets the needs of the customers and stakeholders or not, such strategies improve the performance of the firm and moreover provides diagnostics information on how to improve things (Sharp, 2013). Marketing metrics includes namely  financial metrics, behavioral metrics, memory metrics, physical availability metrics, marketing availability metrics, customer profile metrics.

capture12.png

  • Behavioral metrics: This metrics is generally used in order to measure the consumer behavior by using primary or secondary data, conducting surveys, by taking reviews from a panel of consumers and so forth.
  • Financial metrics: This is one of the most important metrics in market evaluation, financial metrics helps to evaluate the financial statistics of the company it is mathematically expressed as profit = sales revenue – direct costs(invested amount).
  • Memory metrics: A metrics which  which helps to measure on how the consumer think and feel about the brand by using qualitative and quantitative services is referred to as memory metrics, this includes brand awareness, attitude and customer satisfaction.
  • Physical availability metrics: This metrics refers to a strategy in which, making the brand accessible at a visible distance will contribute to its financial revenue.
  • Customer profile metrics: This metrics helps to describe the profile of the customers their behavior and their tastes.

But how does coles uses this metrics?

Behavioral metrics: According to a recent survey conducted in one of the stores of coles they found out that using LED lights helps to extend the nutritious quality of many fresh foods.Moreover, people respond well when there are fruits and vegetables are placed in front of the supermarkets. Furthermore, GPS system in such stores further helps to analyse the consumer behavior.(Thoughts.manthan.com, 2016)

Financial metrics: This metrics includes Return of investment (ROI) net profit revenue and more. In the following figure one can state that the sales growth of coles is enhancing year as compared from its previous years.

120896-120728-b-coles

Memory metrics: A down down ad campaign initiated by coles has helped them tremendously by giving away chicken for reasonable price has enhanced its sales to a profitable one.(Canning and Canning, 2016)

Physical available metrics: From their best quality fruits and vegetables to baby products are all made available under one roof which are made available with proper indications and labels, customer service desk at each store helps the customer to fetch their essential product at any time.

Customer profile metrics: ‘Flybuys’ and other loyalty programs initiated by coles helps the company to collect data of its customers including personal data, buying behavior,  buying vegetarian or non-vegetarian foods and other information helps the company  to analyse and make necessary changes.(NewsMediaWorks, 2016)

How to increase CLV ?

Customer lifetime value is based on the estimation of customer relationship based on future profitability from the customer over its lifetime.(Bendle, 2016)

The slogan of coles is ‘if you don’t take care your customers, some else will’(Colestraining.com, 2013)

Therefore, in order to hold these customers coles has initiated various measures such as:

  • Good customer service
  • Bring back the old customers by promoting themselves on various social medias
  • By initiating Flybuys and other loyalty programs
  • By giving discounts and other fair deals.
  • Wide variety of products under one roof

Conclusion/recommendations:

I personally recommend coles to initiate marketing dashboard techniques, which is a scorecard record of the company’s performance and to inculcate such practices in their business which will help the business to use the available resources effectively and accurately. Therefore, based on the metrics mentioned above one can conclude that initiating marketing evaluation metrics will enhance the growth of any firm and also contribute to its profitability.


References:

Bendle, Neil.T 2016, Marketing metrics : The manager’s guide to measuring marketing performance, Pearson education.

Colestraining.com. (2013). Coles Training – Retaining Customers. [online] Available at: http://www.colestraining.com/customer-service/obtaining-and-retaining-customers/ [Accessed 26 Sep. 2016].

Canning, S. and Canning, S. (2016). Coles goes down down with finger ridin’ chicken – Mumbrella. [online] Mumbrella. Available at: https://mumbrella.com.au/coles-goes-finger-ridin-chicken-372131 [Accessed 26 Sep. 2016].

NewsComAu. (2016). Coles lifts annual sales 6.1pc to $33.7b. [online] Available at: http://www.news.com.au/finance/business/coles-lifts-annual-sales-61-to-337b/story-fnda1bsz-1226435412540 [Accessed 26 Sep. 2016].

NewsMediaWorks. (2016). Woolworths & Coles lead the way in retail advertising. [online] Available at: http://www.newsmediaworks.com.au/woolworths-coles-lead-the-way-in-retail-advertising/

Sharp, B 2013, Marketing: Theory, Evidence, Practice, Oxford University Press, Melbourne, Australia.

Thoughts.manthan.com. (2016). Coles and Woolworth Study Consumer Behavior in Concept Stores | Fresh. [online] Available at: https://thoughts.manthan.com/2014/03/24/coles-and-woolworth-study-consumer-behavior-in-concept-stores [Accessed 26 Sep. 2016].


username: jjacob003

student id: 216034001

Name: Justin Jacob